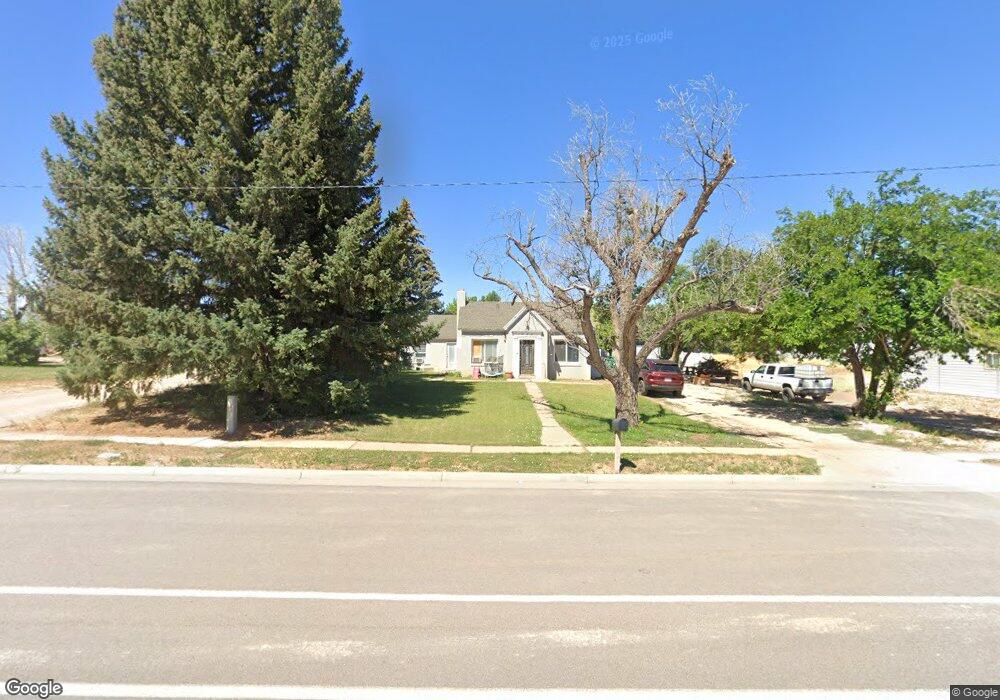
265 N Main St Fillmore, UT 84631
Estimated Value: $235,000 - $378,000
3
Beds
2
Baths
1,612
Sq Ft
$191/Sq Ft
Est. Value
About This Home
This home is located at 265 N Main St, Fillmore, UT 84631 and is currently estimated at $308,358, approximately $191 per square foot. 265 N Main St is a home located in Millard County.
Ownership History
Date
Name
Owned For
Owner Type
Purchase Details
Closed on
Jun 15, 2021
Sold by
Robinson Austin
Bought by
Rowley Kyler and Anderson Brynley H
Current Estimated Value
Home Financials for this Owner
Home Financials are based on the most recent Mortgage that was taken out on this home.
Original Mortgage
$194,000
Outstanding Balance
$174,105
Interest Rate
2.9%
Mortgage Type
New Conventional
Estimated Equity
$134,253
Purchase Details
Closed on
Jun 12, 2020
Sold by
Aleman Filiberto Joshua and Jackson Makena
Bought by
Robinson Austin
Home Financials for this Owner
Home Financials are based on the most recent Mortgage that was taken out on this home.
Original Mortgage
$188,888
Interest Rate
3.2%
Mortgage Type
New Conventional
Purchase Details
Closed on
Sep 7, 2018
Sold by
Porter Nathan and Porter Loraina
Bought by
Aleman Filiberto Joshua and Jackson Makena
Purchase Details
Closed on
Sep 25, 2014
Sold by
Tom Tom
Bought by
Porter Nathan and Porter Loraina
Purchase Details
Closed on
Jan 27, 2014
Bought by
Demolen Tom
Create a Home Valuation Report for This Property
The Home Valuation Report is an in-depth analysis detailing your home's value as well as a comparison with similar homes in the area
Home Values in the Area
Average Home Value in this Area
Purchase History
| Date | Buyer | Sale Price | Title Company |
|---|---|---|---|
| Rowley Kyler | -- | First American Title Insuran | |
| Robinson Austin | -- | First American Title | |
| Aleman Filiberto Joshua | -- | -- | |
| Porter Nathan | -- | First American Title Insur | |
| Demolen Tom | -- | First American Title |
Source: Public Records
Mortgage History
| Date | Status | Borrower | Loan Amount |
|---|---|---|---|
| Open | Rowley Kyler | $194,000 | |
| Previous Owner | Robinson Austin | $188,888 |
Source: Public Records
Tax History
| Year | Tax Paid | Tax Assessment Tax Assessment Total Assessment is a certain percentage of the fair market value that is determined by local assessors to be the total taxable value of land and additions on the property. | Land | Improvement |
|---|---|---|---|---|
| 2025 | $1,476 | $185,435 | $25,618 | $159,817 |
| 2024 | $1,476 | $130,587 | $20,292 | $110,295 |
| 2023 | $1,431 | $130,587 | $20,292 | $110,295 |
| 2022 | $1,196 | $107,424 | $18,448 | $88,976 |
| 2021 | $1,048 | $90,362 | $11,979 | $78,383 |
| 2020 | $853 | $73,927 | $10,890 | $63,037 |
| 2019 | $729 | $63,383 | $10,890 | $52,493 |
| 2018 | $695 | $61,903 | $10,890 | $51,013 |
| 2017 | $655 | $55,475 | $10,890 | $44,585 |
| 2016 | $627 | $55,475 | $10,890 | $44,585 |
| 2015 | $627 | $55,475 | $10,890 | $44,585 |
| 2014 | -- | $76,486 | $19,800 | $56,686 |
| 2013 | -- | $76,486 | $19,800 | $56,686 |
Source: Public Records
Map
Nearby Homes
Your Personal Tour Guide
Ask me questions while you tour the home.