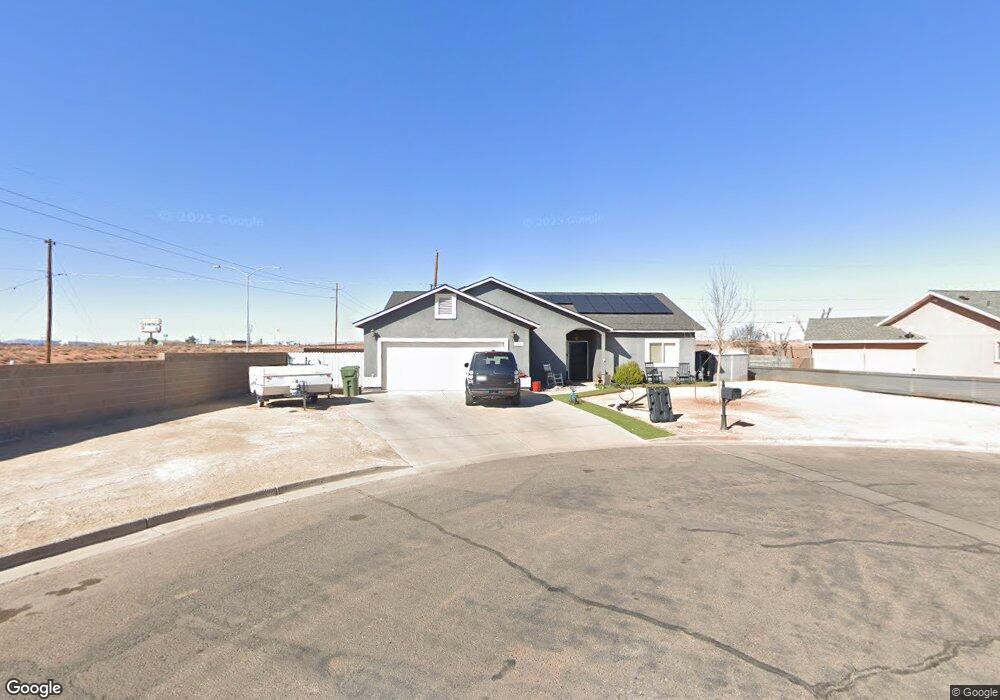
265 Papago Blvd Unit 3 Winslow, AZ 86047
4
Beds
--
Bath
1,735
Sq Ft
8,712
Sq Ft Lot
About This Home
This home is located at 265 Papago Blvd Unit 3, Winslow, AZ 86047. 265 Papago Blvd Unit 3 is a home located in Navajo County with nearby schools including Winslow High School and Red Sands Christian School.
Ownership History
Date
Name
Owned For
Owner Type
Purchase Details
Closed on
Jun 5, 2020
Sold by
Beard Terry M and Beard Pamela J
Bought by
Cavazos Robert and Cavazos Judy
Home Financials for this Owner
Home Financials are based on the most recent Mortgage that was taken out on this home.
Original Mortgage
$228,500
Outstanding Balance
$202,100
Interest Rate
3.2%
Mortgage Type
VA
Purchase Details
Closed on
Jun 23, 2016
Sold by
Inman Patrick
Bought by
Beard Terry M and Beard Pamela J
Home Financials for this Owner
Home Financials are based on the most recent Mortgage that was taken out on this home.
Original Mortgage
$176,739
Interest Rate
3.54%
Mortgage Type
FHA
Purchase Details
Closed on
Mar 23, 2009
Sold by
Brown Teresa Dawn and Inman Teresa Dawn
Bought by
Inman Patrick James
Purchase Details
Closed on
Jun 7, 2006
Sold by
Ohaco Daniel and Mcreynolds Kim O
Bought by
Inman Patrick James and Inman Teresa Dawn
Home Financials for this Owner
Home Financials are based on the most recent Mortgage that was taken out on this home.
Original Mortgage
$183,920
Interest Rate
6.63%
Mortgage Type
New Conventional
Purchase Details
Closed on
Nov 8, 2005
Sold by
Mcreynolds Troy
Bought by
Mcreynolds Kim O
Create a Home Valuation Report for This Property
The Home Valuation Report is an in-depth analysis detailing your home's value as well as a comparison with similar homes in the area
Home Values in the Area
Average Home Value in this Area
Purchase History
| Date | Buyer | Sale Price | Title Company |
|---|---|---|---|
| Cavazos Robert | $228,500 | Pioneer Title Agency Inc | |
| Beard Terry M | -- | Pioneer Title Agency Inc | |
| Inman Patrick James | -- | None Available | |
| Inman Patrick James | $229,900 | First American Title | |
| Mcreynolds Kim O | -- | None Available | |
| Ohaco Daniel | -- | None Available |
Source: Public Records
Mortgage History
| Date | Status | Borrower | Loan Amount |
|---|---|---|---|
| Open | Cavazos Robert | $228,500 | |
| Previous Owner | Beard Terry M | $176,739 | |
| Previous Owner | Inman Patrick James | $183,920 |
Source: Public Records
Tax History Compared to Growth
Tax History
| Year | Tax Paid | Tax Assessment Tax Assessment Total Assessment is a certain percentage of the fair market value that is determined by local assessors to be the total taxable value of land and additions on the property. | Land | Improvement |
|---|---|---|---|---|
| 2026 | $1,272 | -- | -- | -- |
| 2025 | $1,212 | $26,108 | $3,557 | $22,551 |
| 2024 | $1,156 | $22,385 | $2,600 | $19,785 |
| 2023 | $1,212 | $17,766 | $2,250 | $15,516 |
| 2022 | $1,156 | $0 | $0 | $0 |
| 2021 | $1,163 | $0 | $0 | $0 |
| 2020 | $1,129 | $0 | $0 | $0 |
| 2019 | $1,087 | $0 | $0 | $0 |
| 2018 | $1,037 | $0 | $0 | $0 |
| 2017 | $1,041 | $0 | $0 | $0 |
| 2016 | $987 | $0 | $0 | $0 |
| 2015 | $1,040 | $9,052 | $2,125 | $6,927 |
Source: Public Records
Map
Nearby Homes
- 2080 Round House Dr
- 1950 W 3rd St
- 1105 W 3rd St
- 132 Papago Blvd
- 124 Papago Blvd
- 1980 W Third St
- 516 2nd St
- 2600 W 3rd St
- 2700 W Third St Unit 19
- 1012 W Willmae St
- 806 W Henderson St
- 1421 Central St
- 1100 W 2nd St Unit 23
- 1100 W 2nd St
- 58 Well Field Rd
- 415 S Edwin Ave
- 901 N Prairie Ave
- 1498 N Prairie Ave
- 0 Well Field Rd Unit 24407445
- 510 W Aspinwall St
- 265 Papago Blvd
- 261 Papago Blvd
- 268 Papago Blvd
- 257 Papago Blvd
- 260 Papago Blvd
- 01 Mike's Pike
- 256 Papago Blvd
- 247 Papago Blvd
- 249 Papago Blvd
- 252 Papago Blvd
- 245 Papago Blvd
- 248 Papago Blvd
- 0 Iron Horse Subd Unit 144780
- 241 Papago Blvd
- 244 Papago Blvd
- 237 Papago Blvd
- 240 Papago Blvd
- 2068 Iron Horse Dr
- 2044 Iron Horse Dr
- 233 Papago Blvd