Estimated Value: $404,000 - $594,000
3
Beds
3
Baths
2,107
Sq Ft
$227/Sq Ft
Est. Value
About This Home
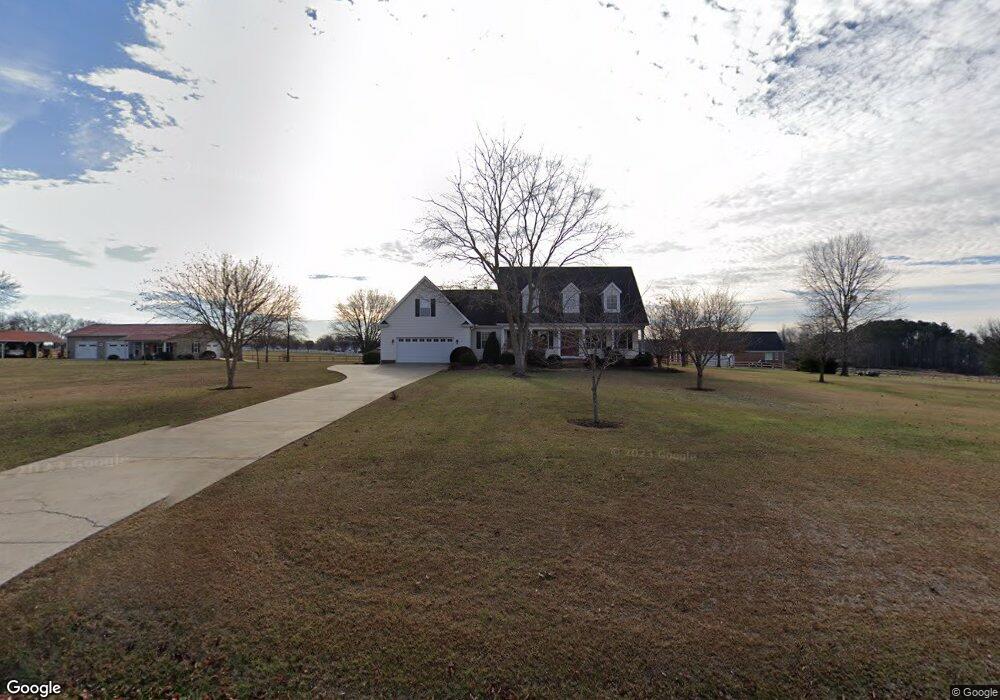
This home is located at 265 Red Maple Rd, Inman, SC 29349 and is currently estimated at $477,319, approximately $226 per square foot. 265 Red Maple Rd is a home located in Spartanburg County with nearby schools including Oakland Elementary School, Boiling Springs Middle School, and Boiling Springs High School.
Ownership History
Date
Name
Owned For
Owner Type
Purchase Details
Closed on
Apr 23, 2025
Sold by
Horton Amanda W
Bought by
Horton Dennis L
Current Estimated Value
Purchase Details
Closed on
Aug 2, 2016
Sold by
Kay Construction
Bought by
Horton Dennis
Home Financials for this Owner
Home Financials are based on the most recent Mortgage that was taken out on this home.
Interest Rate
3.48%
Create a Home Valuation Report for This Property
The Home Valuation Report is an in-depth analysis detailing your home's value as well as a comparison with similar homes in the area
Home Values in the Area
Average Home Value in this Area
Purchase History
| Date | Buyer | Sale Price | Title Company |
|---|---|---|---|
| Horton Dennis L | -- | None Listed On Document | |
| Horton Dennis | -- | -- |
Source: Public Records
Mortgage History
| Date | Status | Borrower | Loan Amount |
|---|---|---|---|
| Previous Owner | Horton Dennis | -- | |
| Previous Owner | Horton Dennis | $57,000 |
Source: Public Records
Tax History Compared to Growth
Tax History
| Year | Tax Paid | Tax Assessment Tax Assessment Total Assessment is a certain percentage of the fair market value that is determined by local assessors to be the total taxable value of land and additions on the property. | Land | Improvement |
|---|---|---|---|---|
| 2025 | $2,320 | $13,034 | $3,098 | $9,936 |
| 2024 | $2,320 | $13,034 | $3,098 | $9,936 |
| 2023 | $2,320 | $13,034 | $3,098 | $9,936 |
| 2022 | $1,965 | $11,334 | $2,518 | $8,816 |
| 2021 | $1,965 | $11,334 | $2,518 | $8,816 |
| 2020 | $1,936 | $11,334 | $2,518 | $8,816 |
| 2019 | $1,936 | $11,334 | $2,518 | $8,816 |
| 2018 | $1,891 | $11,334 | $2,518 | $8,816 |
| 2017 | $1,692 | $10,040 | $2,408 | $7,632 |
| 2016 | $1,693 | $10,040 | $2,408 | $7,632 |
| 2015 | $1,690 | $10,040 | $2,408 | $7,632 |
| 2014 | $1,684 | $10,040 | $2,408 | $7,632 |
Source: Public Records
Map
Nearby Homes
- 655 Autumn Breeze Walk
- 630 Claystone Dr
- 137 Stonehedge Dr
- Middleton Plan at Walnut Ridge
- Parker Plan at Walnut Ridge
- Cameron Plan at Walnut Ridge
- Drayton Plan at Walnut Ridge
- Cooper 3 Plan at Walnut Ridge
- Augusta Plan at Walnut Ridge
- Finley Plan at Walnut Ridge
- 12144 Mahogany Cir
- 12124 Mahogany Cir
- 15035 Juglans Ct
- 12145 Mahogany Cir
- 12123 Mahogany Cir
- 12149 Mahogany Cir
- 12119 Mahogany Cir
- 7003 Wingate Dr
- 7003 Wingate Dr Unit Homesite 90
- 7006 Wingate Dr
- 250 Red Maple Rd
- 610 Sugar Ridge Rd
- 624 Sugar Ridge Rd
- 130 Red Maple Rd
- 285 Red Maple Rd
- 280 Red Maple Rd Unit 284
- 590 Sugar Ridge Rd
- 621 Sugar Ridge Rd
- 299 Red Maple Rd Unit 305
- 661 Sugar Ridge Rd
- 696 Sugar Ridge Rd
- 696 Sugar Ridge Rd
- 696 Sugar Ridge Rd
- 691 Sugar Ridge Rd
- 300 Red Maple Rd
- 1438 Cattleman Acrs Dr
- 693 Sugar Ridge Rd
- 321 Red Maple Rd
- 699 Sugar Ridge Rd
- 320 Red Maple Rd