Estimated Value: $1,319,745
--
Bed
--
Bath
11,932
Sq Ft
$111/Sq Ft
Est. Value
About This Home
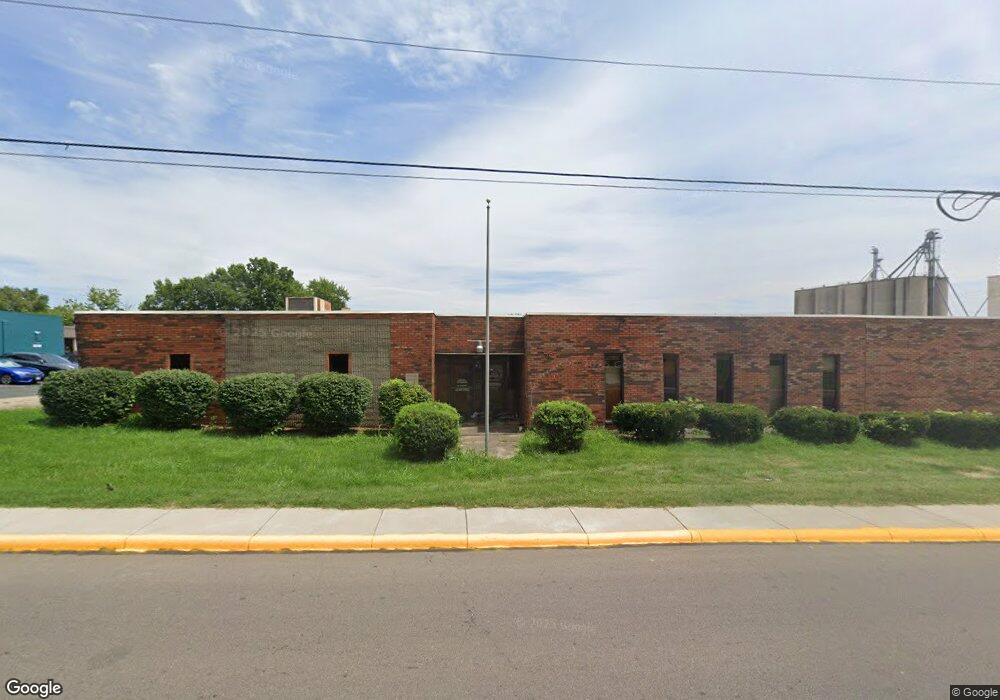
This home is located at 265 S Allison Ave Unit 275, Xenia, OH 45385 and is currently estimated at $1,319,745, approximately $110 per square foot. 265 S Allison Ave Unit 275 is a home located in Greene County with nearby schools including Xenia High School, Summit Academy Community School for Alternative Learners - Xenia, and Legacy Christian Academy.
Ownership History
Date
Name
Owned For
Owner Type
Purchase Details
Closed on
Jul 1, 2015
Sold by
Lane Jeff
Bought by
Hernandez Haydee L
Current Estimated Value
Purchase Details
Closed on
Nov 9, 2000
Sold by
Ohio Properties Llc
Bought by
Cornerstone Investment Of Indianapolis
Home Financials for this Owner
Home Financials are based on the most recent Mortgage that was taken out on this home.
Original Mortgage
$400,000
Interest Rate
7.87%
Mortgage Type
Commercial
Purchase Details
Closed on
Feb 29, 2000
Sold by
Resource Development Properties Inc
Bought by
Ohio Properties Llc
Home Financials for this Owner
Home Financials are based on the most recent Mortgage that was taken out on this home.
Original Mortgage
$400,000
Interest Rate
7.87%
Mortgage Type
Commercial
Purchase Details
Closed on
Dec 20, 1995
Sold by
Resource Dev Properties
Bought by
D & J Enterprises
Create a Home Valuation Report for This Property
The Home Valuation Report is an in-depth analysis detailing your home's value as well as a comparison with similar homes in the area
Home Values in the Area
Average Home Value in this Area
Purchase History
| Date | Buyer | Sale Price | Title Company |
|---|---|---|---|
| Hernandez Haydee L | $39,900 | Attorney | |
| Cornerstone Investment Of Indianapolis | $575,000 | -- | |
| Ohio Properties Llc | $350,000 | -- | |
| D & J Enterprises | $7,150,000 | -- |
Source: Public Records
Mortgage History
| Date | Status | Borrower | Loan Amount |
|---|---|---|---|
| Previous Owner | Cornerstone Investment Of Indianapolis | $400,000 | |
| Previous Owner | Ohio Properties Llc | $400,000 | |
| Closed | D & J Enterprises | $0 |
Source: Public Records
Tax History Compared to Growth
Tax History
| Year | Tax Paid | Tax Assessment Tax Assessment Total Assessment is a certain percentage of the fair market value that is determined by local assessors to be the total taxable value of land and additions on the property. | Land | Improvement |
|---|---|---|---|---|
| 2024 | $773 | $15,260 | $7,590 | $7,670 |
| 2023 | $773 | $15,260 | $7,590 | $7,670 |
| 2022 | $873 | $14,670 | $7,590 | $7,080 |
| 2021 | $887 | $14,670 | $7,590 | $7,080 |
| 2020 | $854 | $14,670 | $7,590 | $7,080 |
| 2019 | $852 | $14,080 | $7,590 | $6,490 |
| 2018 | $859 | $14,100 | $7,590 | $6,510 |
| 2017 | $862 | $14,100 | $7,590 | $6,510 |
| 2016 | $862 | $14,010 | $7,740 | $6,270 |
| 2015 | $2,848 | $46,110 | $31,640 | $14,470 |
| 2014 | $2,751 | $46,110 | $31,640 | $14,470 |
Source: Public Records
Map
Nearby Homes
- 265 S Allison Ave
- 275 S Allison Ave
- 426 Bellbrook Ave
- 2241 S Allison Ave
- 254 S Allison Ave
- 254 S Allison Ave
- 252 S Allison Ave
- 416 Bellbrook Ave
- 735 Trumbull St Unit 2,3,7
- 735 Trumbull St Unit 739
- 420 Bellbrook Ave
- 735 Trumbull St
- 430 Bellbrook Ave
- 242 S Allison Ave
- 225 S Allison Ave
- 396 Bellbrook Ave
- 215 S Allison Ave Unit 225
- 739 Trumbull St
- 711 Trumbull St
- 214 S Allison Ave