R
Seller's Agent in 2017
R.B. Gentry
R. B. Gentry & Associates
Estimated Value: $450,000 - $512,000
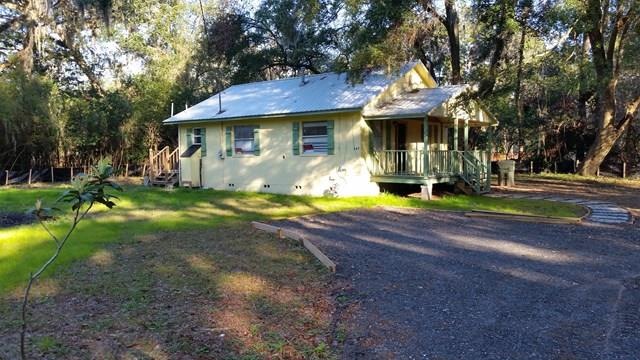
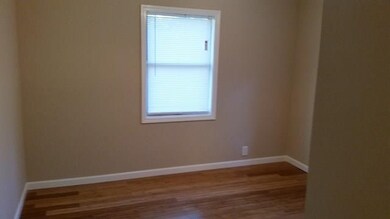
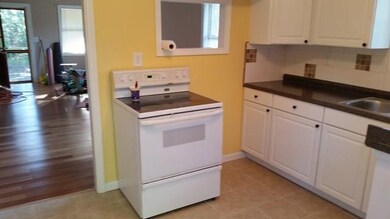
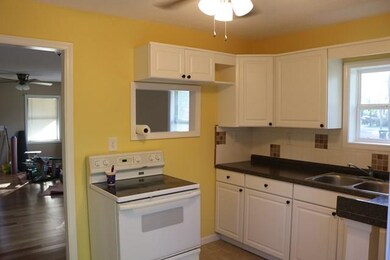
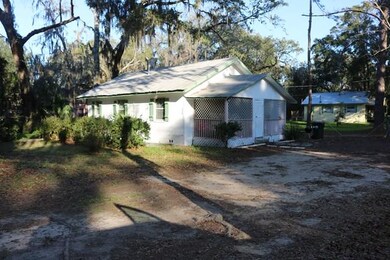
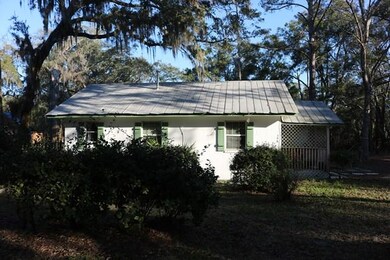
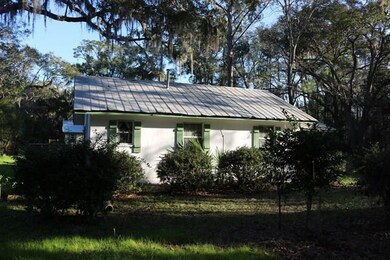
Rarely does an opportunity like this exist on St. Simons Island. Our owner is not only selling two adjacent homes together, but prefers to finance them (for a qualified buyer). Sitting under a canopy of oaks, these cute homes w/metal roofs offer 768 and 832 sqft respectively and each has a full kitchen, 2Br and 1 full Ba with living/dining room combo and a deck.. Each is situated on over a quarter-acre and one has been rented for over 5 years to a responsible tenant! These homes are NOT in a flood zone and much "updating" has already been accomplished. New heat pump in one and a two year old roof on the other. 24 hour notice to show the rented home (265 S. Harrington.) Seller prefers both be sold as a package - a weekend on St. Simons Island is better than a lifetime anywhere else!
Last Agent to Sell the Property
R.B. Gentry
R. B. Gentry & Associates License #120521 Listed on: 02/06/2017
| Date | Buyer | Sale Price | Title Company |
|---|---|---|---|
| Michael Waters W | $135,000 | -- |
| Date | Event | Price | List to Sale | Price per Sq Ft |
|---|---|---|---|---|
| 06/16/2017 06/16/17 | Sold | $260,000 | -13.3% | $313 / Sq Ft |
| 06/03/2017 06/03/17 | Pending | -- | -- | -- |
| 02/06/2017 02/06/17 | For Sale | $299,900 | -- | $360 / Sq Ft |
| Year | Tax Paid | Tax Assessment Tax Assessment Total Assessment is a certain percentage of the fair market value that is determined by local assessors to be the total taxable value of land and additions on the property. | Land | Improvement |
|---|---|---|---|---|
| 2025 | $1,468 | $58,520 | $37,400 | $21,120 |
| 2024 | $1,460 | $58,200 | $37,400 | $20,800 |
| 2023 | $1,680 | $58,200 | $37,400 | $20,800 |
| 2022 | $1,654 | $56,000 | $35,200 | $20,800 |
| 2021 | $1,637 | $53,640 | $35,200 | $18,440 |
| 2020 | $1,651 | $53,640 | $35,200 | $18,440 |
R
Seller's Agent in 2017
R.B. Gentry
R. B. Gentry & Associates

Buyer's Agent in 2017
Hannah Melton
Duckworth Properties BWK
(912) 269-7512
91 in this area
412 Total Sales
Source: Golden Isles Association of REALTORS®
MLS Number: 1582197
APN: 04-15193
Disclaimer: Certain information contained herein is derived from information provided by parties other than Homes.com. All information provided is deemed reliable, but is not guaranteed to be accurate and should be independently verified.
![]() IDX information is provided exclusively for personal, non-commercial use, and may not be used for any purpose other than to identify prospective properties consumers may be interested in purchasing. Information is deemed reliable but not guaranteed.
IDX information is provided exclusively for personal, non-commercial use, and may not be used for any purpose other than to identify prospective properties consumers may be interested in purchasing. Information is deemed reliable but not guaranteed.