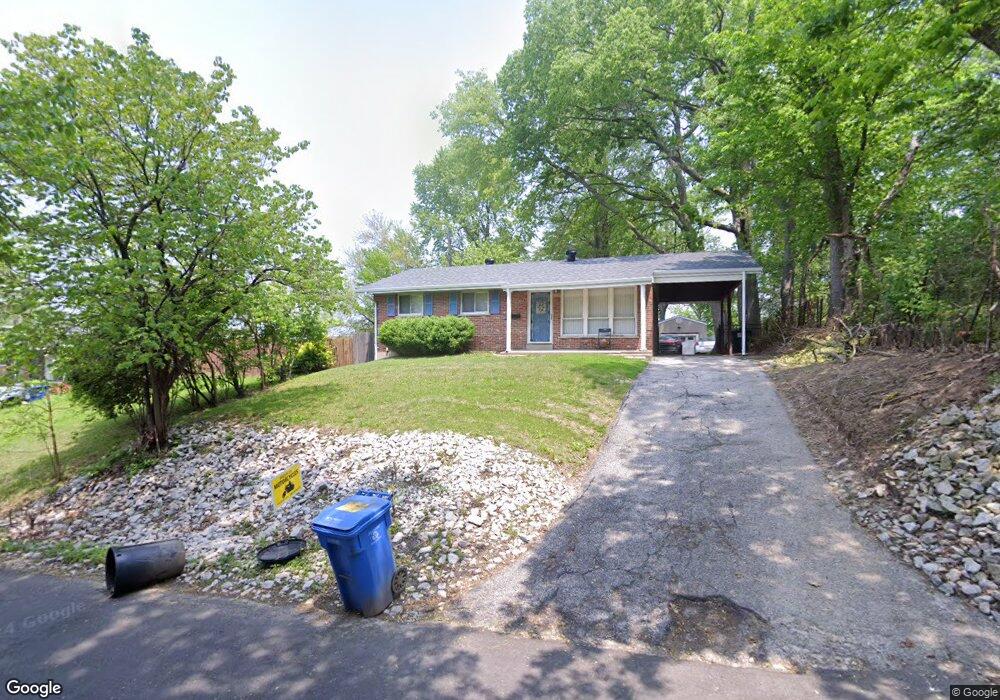
265 Saint Denis St Unit A Florissant, MO 63031
Estimated Value: $170,000 - $406,000
--
Bed
--
Bath
--
Sq Ft
4,617
Sq Ft Lot
About This Home
This home is located at 265 Saint Denis St Unit A, Florissant, MO 63031 and is currently estimated at $309,667. 265 Saint Denis St Unit A is a home located in St. Louis County with nearby schools including Combs Elementary School, Cross Keys Middle School, and McCluer North High School.
Ownership History
Date
Name
Owned For
Owner Type
Purchase Details
Closed on
Mar 9, 2020
Sold by
Home Run Mo Llc
Bought by
Haller Heather
Current Estimated Value
Home Financials for this Owner
Home Financials are based on the most recent Mortgage that was taken out on this home.
Original Mortgage
$103,098
Outstanding Balance
$91,308
Interest Rate
3.5%
Mortgage Type
New Conventional
Estimated Equity
$218,359
Purchase Details
Closed on
Mar 6, 2017
Sold by
Fannie Mae
Bought by
Fimmen Derek
Home Financials for this Owner
Home Financials are based on the most recent Mortgage that was taken out on this home.
Original Mortgage
$38,625
Interest Rate
4.09%
Mortgage Type
New Conventional
Purchase Details
Closed on
Jun 26, 2002
Sold by
Delaney Stella A
Bought by
Morley David B and Morley Tamara S
Home Financials for this Owner
Home Financials are based on the most recent Mortgage that was taken out on this home.
Original Mortgage
$55,800
Interest Rate
6.78%
Mortgage Type
Purchase Money Mortgage
Create a Home Valuation Report for This Property
The Home Valuation Report is an in-depth analysis detailing your home's value as well as a comparison with similar homes in the area
Home Values in the Area
Average Home Value in this Area
Purchase History
| Date | Buyer | Sale Price | Title Company |
|---|---|---|---|
| Haller Heather | $106,000 | Clear Title Group | |
| Fimmen Derek | -- | Insight Title | |
| Morley David B | $62,000 | -- |
Source: Public Records
Mortgage History
| Date | Status | Borrower | Loan Amount |
|---|---|---|---|
| Open | Haller Heather | $103,098 | |
| Previous Owner | Fimmen Derek | $38,625 | |
| Previous Owner | Morley David B | $55,800 |
Source: Public Records
Tax History Compared to Growth
Tax History
| Year | Tax Paid | Tax Assessment Tax Assessment Total Assessment is a certain percentage of the fair market value that is determined by local assessors to be the total taxable value of land and additions on the property. | Land | Improvement |
|---|---|---|---|---|
| 2025 | $14 | $270 | $270 | -- |
| 2024 | $14 | $190 | $190 | -- |
| 2023 | $14 | $190 | $190 | $0 |
| 2022 | $23 | $270 | $270 | $0 |
| 2021 | $23 | $270 | $270 | $0 |
| 2020 | $23 | $250 | $250 | $0 |
| 2019 | $22 | $250 | $250 | $0 |
| 2018 | $29 | $290 | $290 | $0 |
| 2017 | $180 | $290 | $290 | $0 |
| 2016 | $370 | $3,650 | $3,650 | $0 |
| 2015 | $372 | $3,650 | $3,650 | $0 |
| 2014 | $175 | $1,770 | $1,770 | $0 |
Source: Public Records
Map
Nearby Homes
- 849 Saint Ferdinand St
- 733 Rue Saint Charles St
- 6 Redwood Dr
- 410 N Jefferson St
- 13 Saint Celeste Dr
- 1365 Saint Jean St
- 865 Boone St
- 1105 Patterson Rd
- 1415 Saint Jean St
- 260 N Jefferson St
- 580 Saint Marie St
- 1148 Boone St
- 1023 Saint Denis St
- 37 Marquette Dr
- 1540 Angelus Dr
- 175 Clark St
- 1090 Saint Joseph St
- 1480 Vesper Dr
- 43 Saint Celeste Dr
- 130 Ruth Dr
- 265 Saint Denis St
- 1 Saint Pierre Ct
- 289 Saint Denis St
- 830 Saint Ferdinand St
- 830 Saint Ferdinand St Unit Rue
- 840 Saint Ferdinand St
- 840 Rue St Ferdinand St
- 830 Rue St Ferdinand St
- 245 Saint Denis St
- 2 Saint Pierre Ct
- 850 Rue St Ferdinand St
- 870 Saint Ferdinand St Unit Rue
- 870 Saint Ferdinand St
- 3 Saint Pierre Ct
- 870 Rue St Ferdinand St
- 795 Saint Pierre St
- 890 Saint Ferdinand St
- 4 Saint Pierre Ct
- 9 Saint Pierre Ct
- 785 Saint Pierre St