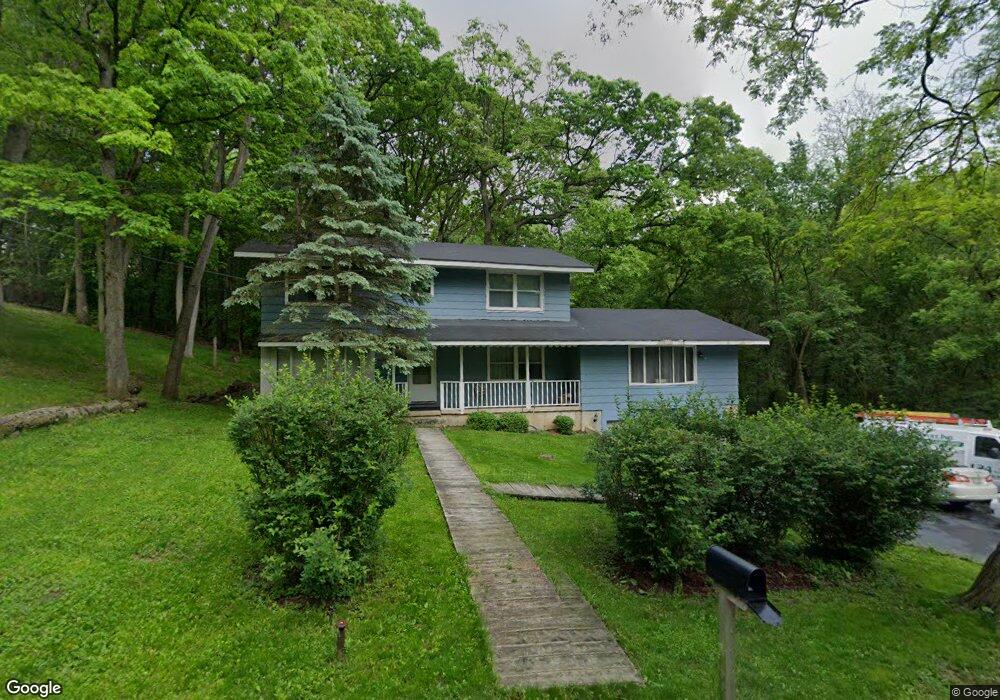
265 Skyline Dr Unit 1 Carpentersville, IL 60110
Estimated Value: $323,018 - $371,000
4
Beds
--
Bath
2,212
Sq Ft
$157/Sq Ft
Est. Value
About This Home
This home is located at 265 Skyline Dr Unit 1, Carpentersville, IL 60110 and is currently estimated at $347,755, approximately $157 per square foot. 265 Skyline Dr Unit 1 is a home located in Kane County with nearby schools including Lakewood School, Crescent City Grade School, and Carpentersville Middle School.
Ownership History
Date
Name
Owned For
Owner Type
Purchase Details
Closed on
Jun 30, 1998
Sold by
Brazile Daniel L and Brazile Cathleen O
Bought by
Martinez J Cruz and Martinez Rosario
Current Estimated Value
Home Financials for this Owner
Home Financials are based on the most recent Mortgage that was taken out on this home.
Original Mortgage
$106,400
Outstanding Balance
$22,115
Interest Rate
7.18%
Estimated Equity
$325,640
Purchase Details
Closed on
Aug 25, 1996
Sold by
Giffin Richard L and Giffin Richard L
Bought by
Brazile Daniel L and Brazile Cathleen O
Home Financials for this Owner
Home Financials are based on the most recent Mortgage that was taken out on this home.
Original Mortgage
$124,693
Interest Rate
8.14%
Mortgage Type
FHA
Create a Home Valuation Report for This Property
The Home Valuation Report is an in-depth analysis detailing your home's value as well as a comparison with similar homes in the area
Home Values in the Area
Average Home Value in this Area
Purchase History
| Date | Buyer | Sale Price | Title Company |
|---|---|---|---|
| Martinez J Cruz | $133,000 | Inter County Title Co | |
| Brazile Daniel L | $135,500 | -- |
Source: Public Records
Mortgage History
| Date | Status | Borrower | Loan Amount |
|---|---|---|---|
| Open | Martinez J Cruz | $106,400 | |
| Previous Owner | Brazile Daniel L | $124,693 |
Source: Public Records
Tax History Compared to Growth
Tax History
| Year | Tax Paid | Tax Assessment Tax Assessment Total Assessment is a certain percentage of the fair market value that is determined by local assessors to be the total taxable value of land and additions on the property. | Land | Improvement |
|---|---|---|---|---|
| 2024 | $7,274 | $101,186 | $12,709 | $88,477 |
| 2023 | $6,847 | $91,044 | $11,435 | $79,609 |
| 2022 | $7,375 | $94,476 | $11,435 | $83,041 |
| 2021 | $7,176 | $89,204 | $10,797 | $78,407 |
| 2020 | $7,038 | $87,198 | $10,554 | $76,644 |
| 2019 | $6,857 | $82,778 | $10,019 | $72,759 |
| 2018 | $6,284 | $73,747 | $9,821 | $63,926 |
| 2017 | $5,444 | $62,178 | $9,187 | $52,991 |
| 2016 | $5,166 | $55,600 | $13,691 | $41,909 |
| 2015 | -- | $52,099 | $12,829 | $39,270 |
| 2014 | -- | $50,661 | $12,475 | $38,186 |
| 2013 | -- | $52,212 | $12,857 | $39,355 |
Source: Public Records
Map
Nearby Homes
- 171 Lake Shore Dr
- 149 Austin Ave
- 181 Skyline Dr
- 105 Siesta Rd
- 1426 Kings Rd
- 157 Austin Ave
- 200 Amarillo Dr
- 327 Tulsa Ave
- 308 Amarillo Ct
- 135 Indian Ln
- 7 Austin Ave
- 140 Hickory Dr
- 4 Austin Ave
- 494 Rosewood Dr
- 1040 Rosewood Dr
- 1317 Brookdale Dr
- 103 Hickory Dr
- 1244 Brookdale Dr
- 1431 Silverstone Dr Unit 1416
- 2013 Silverstone Dr Unit 2013
- 269 Skyline Dr
- 260 Deerpath Ln
- 271 Skyline Dr
- 259 Skyline Dr
- 261 Deerpath Ln
- 184 Lake Shore Dr Unit 2
- 263 Deerpath Ln
- 266 Deerpath Ln
- 265 Deerpath Ln
- 1547 Amarillo Dr
- 178 Lake Shore Dr
- 267 Deerpath Ln
- 268 Deerpath Ln Unit 1
- 1549 Amarillo Dr
- 1551 Amarillo Dr
- 1545 Amarillo Dr
- 269 Deerpath Ln
- 108 Austin Ave
- 1737 Queens Ct
- 288 Skyline Dr