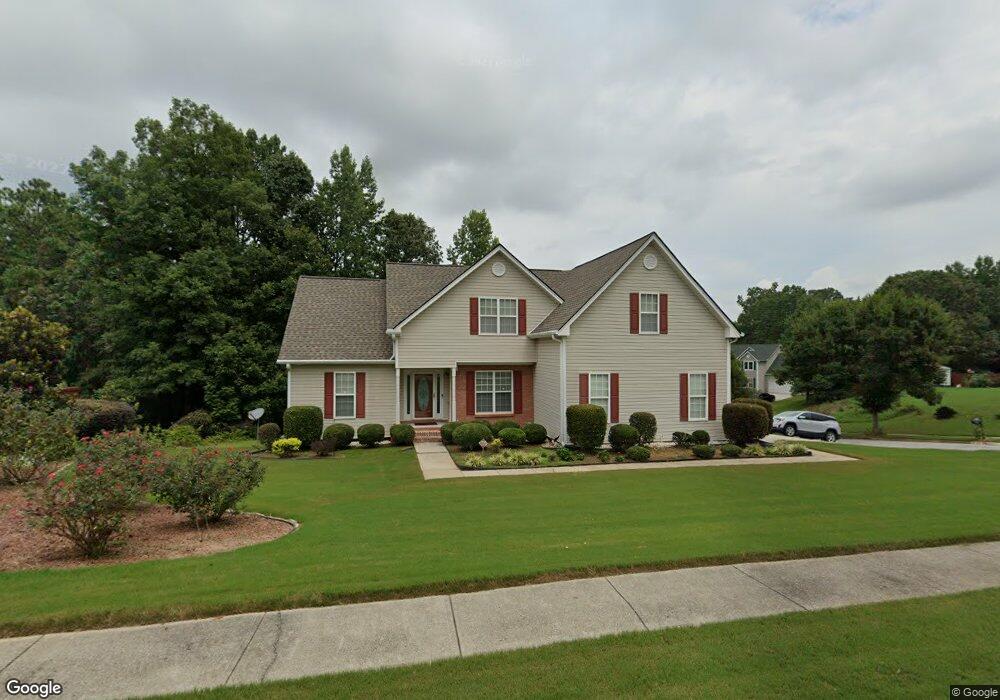
265 Trelawney Dr Unit 2 Covington, GA 30016
Estimated Value: $330,000 - $364,000
--
Bed
2
Baths
2,035
Sq Ft
$168/Sq Ft
Est. Value
About This Home
This home is located at 265 Trelawney Dr Unit 2, Covington, GA 30016 and is currently estimated at $342,785, approximately $168 per square foot. 265 Trelawney Dr Unit 2 is a home located in Newton County with nearby schools including Porterdale Elementary School, Clements Middle School, and Newton High School.
Ownership History
Date
Name
Owned For
Owner Type
Purchase Details
Closed on
Sep 1, 2021
Sold by
Robinson Canute Donat
Bought by
Canute Donat Robinson Rev Tr and Karlene Hope Angela Robinson Rev Tr
Current Estimated Value
Purchase Details
Closed on
Dec 28, 2001
Sold by
Robinson Canute D
Bought by
Robinson Canute D and Robinson Karlene H
Home Financials for this Owner
Home Financials are based on the most recent Mortgage that was taken out on this home.
Original Mortgage
$131,100
Interest Rate
6.72%
Mortgage Type
New Conventional
Purchase Details
Closed on
Nov 28, 2001
Sold by
Elmo Fortenberry Bldr Inc
Bought by
Robinson Canute D
Home Financials for this Owner
Home Financials are based on the most recent Mortgage that was taken out on this home.
Original Mortgage
$131,100
Interest Rate
6.72%
Mortgage Type
New Conventional
Create a Home Valuation Report for This Property
The Home Valuation Report is an in-depth analysis detailing your home's value as well as a comparison with similar homes in the area
Home Values in the Area
Average Home Value in this Area
Purchase History
| Date | Buyer | Sale Price | Title Company |
|---|---|---|---|
| Canute Donat Robinson Rev Tr | -- | -- | |
| Robinson Canute D | -- | -- | |
| Robinson Canute D | $163,900 | -- |
Source: Public Records
Mortgage History
| Date | Status | Borrower | Loan Amount |
|---|---|---|---|
| Previous Owner | Robinson Canute D | $131,100 |
Source: Public Records
Tax History Compared to Growth
Tax History
| Year | Tax Paid | Tax Assessment Tax Assessment Total Assessment is a certain percentage of the fair market value that is determined by local assessors to be the total taxable value of land and additions on the property. | Land | Improvement |
|---|---|---|---|---|
| 2024 | $2,865 | $151,360 | $18,000 | $133,360 |
| 2023 | $2,975 | $135,560 | $8,800 | $126,760 |
| 2022 | $2,543 | $119,640 | $8,800 | $110,840 |
| 2021 | $2,427 | $81,160 | $8,800 | $72,360 |
| 2020 | $2,534 | $76,880 | $8,800 | $68,080 |
| 2019 | $2,222 | $66,640 | $8,800 | $57,840 |
| 2018 | $2,105 | $62,800 | $8,800 | $54,000 |
| 2017 | $2,037 | $60,840 | $8,800 | $52,040 |
| 2016 | $1,758 | $52,720 | $3,400 | $49,320 |
| 2015 | $1,444 | $43,560 | $3,400 | $40,160 |
| 2014 | $1,393 | $42,160 | $0 | $0 |
Source: Public Records
Map
Nearby Homes
- 11637 Brown Bridge Rd
- 15 Beaverdam Ln
- 75 Trelawney Keep Unit 9
- 40 Tuesday Ct
- 80 Woodland Ridge Cir
- 216 Upper River Rd
- 75 Havenwood Ln
- 255 Heaton Place Trail
- 115 Woodland Ridge Cir
- 40 Brandon Dr
- 11889 Brown Bridge Rd
- 510 Stonecreek Ln Unit 56
- 250 Stonecreek Pkwy
- 65 Westover Place Unit 1
- 40 Cindy Cir
- 0 Crowell Rd Unit 10620922
- 0 Crowell Rd Unit 7662435
- 0 Crowell Rd Unit 24687706
- 0 Crowell Rd Unit 10600991
- 165 Randy Trace
- 270 Trelawney Dr
- 245 Trelawney Cir
- 285 Trelawney Dr
- 80 Trelawney Cir
- 65 Trelawney Cir
- 65 Trelawney Cir Unit 2/229
- 290 Trelawney Dr
- 0 Trelawney Cir Unit 8616713
- 0 Trelawney Cir Unit 8536214
- 0 Trelawney Cir Unit 8013939
- 0 Trelawney Cir Unit 7641054
- 0 Trelawney Cir Unit 2856234
- 0 Trelawney Cir Unit 7000436
- 0 Trelawney Cir Unit 8125295
- 0 Trelawney Cir Unit 8263531
- 0 Trelawney Cir Unit 7166468
- 0 Trelawney Cir Unit 8956102
- 0 Trelawney Cir Unit 9040709
- 0 Trelawney Cir Unit 8756913
- 0 Trelawney Cir Unit 8777204