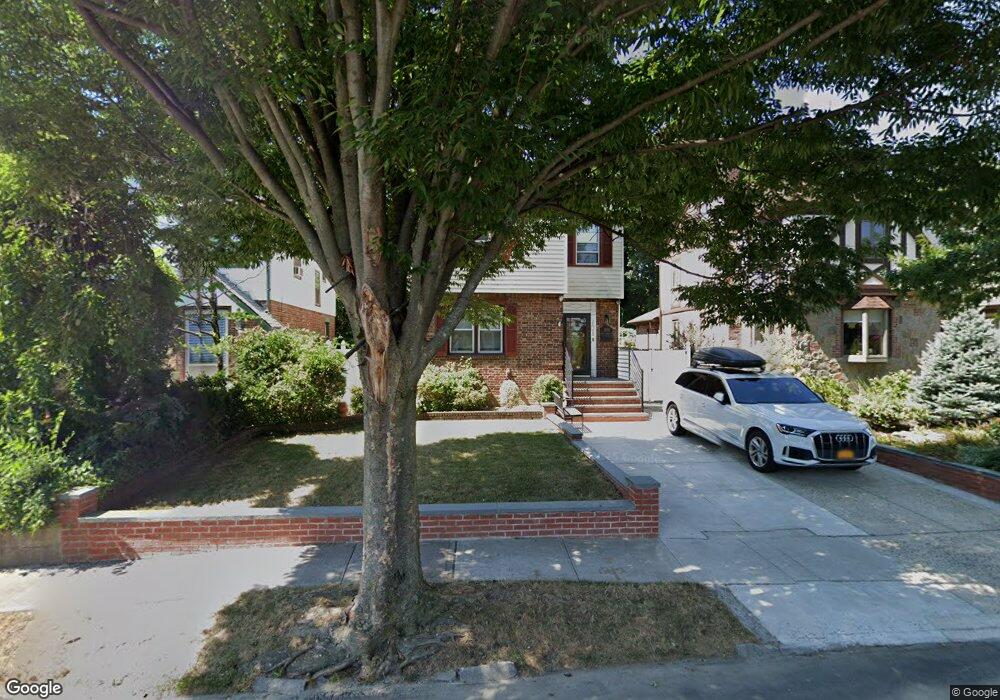
2650 202nd St Bayside, NY 11360
Auburndale NeighborhoodEstimated Value: $1,042,000 - $1,193,319
--
Bed
--
Bath
1,368
Sq Ft
$818/Sq Ft
Est. Value
About This Home
This home is located at 2650 202nd St, Bayside, NY 11360 and is currently estimated at $1,119,330, approximately $818 per square foot. 2650 202nd St is a home located in Queens County with nearby schools including P.S. 159 Queens, I.S. 25 Adrien Block, and Bayside High School.
Ownership History
Date
Name
Owned For
Owner Type
Purchase Details
Closed on
Nov 22, 2022
Sold by
Tse Alice and Tse Tse
Bought by
Gao Jie and Lin Yuqian
Current Estimated Value
Home Financials for this Owner
Home Financials are based on the most recent Mortgage that was taken out on this home.
Original Mortgage
$564,000
Outstanding Balance
$545,808
Interest Rate
7.08%
Mortgage Type
Purchase Money Mortgage
Estimated Equity
$573,522
Purchase Details
Closed on
Jun 27, 2011
Sold by
Kim Chi Gu and Kim In Soon
Bought by
Tse Alice and Tse Derek Chun
Home Financials for this Owner
Home Financials are based on the most recent Mortgage that was taken out on this home.
Original Mortgage
$499,000
Interest Rate
4.6%
Mortgage Type
Purchase Money Mortgage
Purchase Details
Closed on
Sep 26, 2000
Sold by
Dyon Charles R
Bought by
Dyon Charles R
Create a Home Valuation Report for This Property
The Home Valuation Report is an in-depth analysis detailing your home's value as well as a comparison with similar homes in the area
Home Values in the Area
Average Home Value in this Area
Purchase History
| Date | Buyer | Sale Price | Title Company |
|---|---|---|---|
| Gao Jie | $1,128,000 | -- | |
| Gao Jie | $1,128,000 | -- | |
| Gao Jie | $1,128,000 | -- | |
| Tse Alice | $667,000 | -- | |
| Tse Alice | $667,000 | -- | |
| Dyon Charles R | -- | -- | |
| Dyon Charles R | -- | -- |
Source: Public Records
Mortgage History
| Date | Status | Borrower | Loan Amount |
|---|---|---|---|
| Open | Gao Jie | $564,000 | |
| Closed | Gao Jie | $564,000 | |
| Previous Owner | Tse Alice | $499,000 |
Source: Public Records
Tax History Compared to Growth
Tax History
| Year | Tax Paid | Tax Assessment Tax Assessment Total Assessment is a certain percentage of the fair market value that is determined by local assessors to be the total taxable value of land and additions on the property. | Land | Improvement |
|---|---|---|---|---|
| 2025 | $8,722 | $44,358 | $11,613 | $32,745 |
| 2024 | $8,722 | $43,424 | $11,730 | $31,694 |
| 2023 | $8,290 | $41,274 | $11,009 | $30,265 |
| 2022 | $7,810 | $60,240 | $15,300 | $44,940 |
| 2021 | $7,781 | $57,600 | $15,300 | $42,300 |
| 2020 | $7,824 | $56,340 | $15,300 | $41,040 |
| 2019 | $7,570 | $57,600 | $15,300 | $42,300 |
| 2018 | $6,714 | $34,395 | $9,431 | $24,964 |
| 2017 | $6,346 | $32,602 | $10,604 | $21,998 |
| 2016 | $5,850 | $32,602 | $10,604 | $21,998 |
| 2015 | $3,490 | $30,804 | $12,543 | $18,261 |
| 2014 | $3,490 | $30,156 | $12,297 | $17,859 |
Source: Public Records
Map
Nearby Homes
- 201-20 28th Ave
- 201-05 28th Ave
- 26-23 Utopia Pkwy
- 19929 26th Ave
- 199-27 26th Ave
- 3211 204th St
- 28-07 172nd St
- 32-28 202nd St
- 169-56 24th Ave Unit HOUSE
- 23-14 205th St
- 20015 33rd Ave
- 20206 33rd Ave
- 32-12 208th St
- 21-38 202nd St Unit 1-207
- 21-38 202nd St Unit 2
- 3314 204th St
- 208-22 26th Ave
- 3321 201st St
- 28-34 Corporal Kennedy St
- 20520 33rd Ave