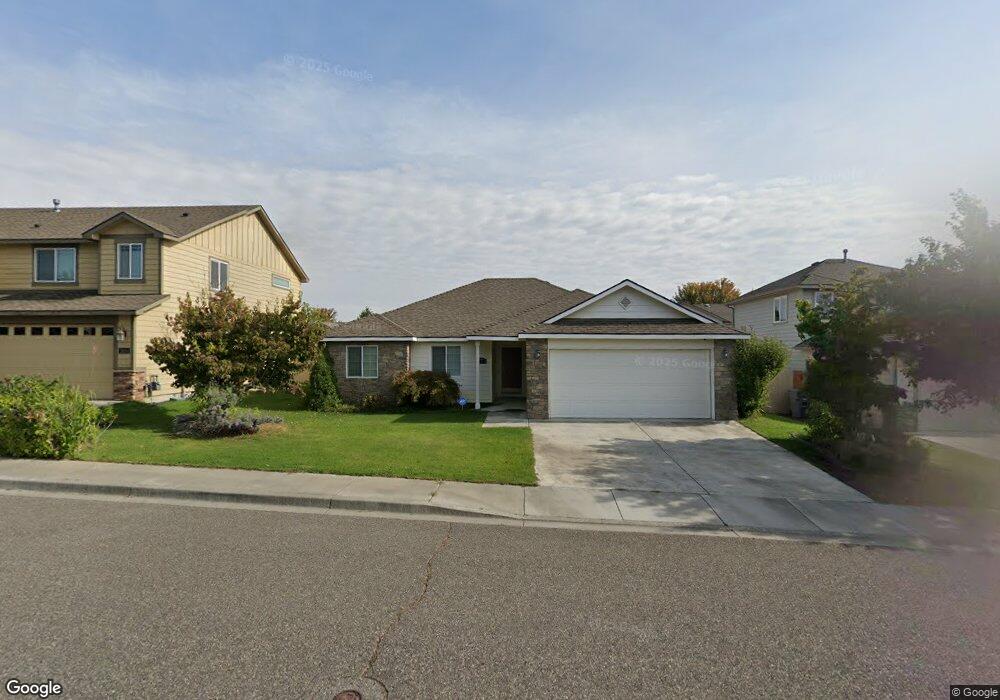
2650 Torrey Pines Way Unit Horn Rapids Rambler Richland, WA 99354
Estimated Value: $426,000 - $440,000
3
Beds
2
Baths
1,404
Sq Ft
$308/Sq Ft
Est. Value
About This Home
This home is located at 2650 Torrey Pines Way Unit Horn Rapids Rambler, Richland, WA 99354 and is currently estimated at $432,805, approximately $308 per square foot. 2650 Torrey Pines Way Unit Horn Rapids Rambler is a home located in Benton County with nearby schools including Sacajawea Elementary School, Chief Joseph Middle School, and Hanford High School.
Ownership History
Date
Name
Owned For
Owner Type
Purchase Details
Closed on
Sep 8, 2022
Sold by
Huang and Chao
Bought by
Putz Anthony
Current Estimated Value
Home Financials for this Owner
Home Financials are based on the most recent Mortgage that was taken out on this home.
Original Mortgage
$412,224
Outstanding Balance
$393,737
Interest Rate
5.22%
Mortgage Type
VA
Estimated Equity
$39,068
Purchase Details
Closed on
Jun 15, 2017
Sold by
Bradfield Kellie A
Bought by
Huang Sen and Liu Chao
Home Financials for this Owner
Home Financials are based on the most recent Mortgage that was taken out on this home.
Original Mortgage
$173,600
Interest Rate
4.02%
Mortgage Type
New Conventional
Purchase Details
Closed on
Feb 13, 2008
Sold by
Diamond Built Homes Llc
Bought by
Bradfield Kellie A
Home Financials for this Owner
Home Financials are based on the most recent Mortgage that was taken out on this home.
Original Mortgage
$206,700
Interest Rate
6.04%
Mortgage Type
Purchase Money Mortgage
Create a Home Valuation Report for This Property
The Home Valuation Report is an in-depth analysis detailing your home's value as well as a comparison with similar homes in the area
Home Values in the Area
Average Home Value in this Area
Purchase History
| Date | Buyer | Sale Price | Title Company |
|---|---|---|---|
| Putz Anthony | -- | -- | |
| Huang Sen | $217,000 | Stewart Title Company | |
| Bradfield Kellie A | $206,931 | Frontier Title & Escrow Co |
Source: Public Records
Mortgage History
| Date | Status | Borrower | Loan Amount |
|---|---|---|---|
| Open | Putz Anthony | $412,224 | |
| Previous Owner | Huang Sen | $173,600 | |
| Previous Owner | Bradfield Kellie A | $206,700 |
Source: Public Records
Tax History Compared to Growth
Tax History
| Year | Tax Paid | Tax Assessment Tax Assessment Total Assessment is a certain percentage of the fair market value that is determined by local assessors to be the total taxable value of land and additions on the property. | Land | Improvement |
|---|---|---|---|---|
| 2024 | $3,490 | $433,420 | $70,000 | $363,420 |
| 2023 | $3,490 | $372,060 | $70,000 | $302,060 |
| 2022 | $2,592 | $255,990 | $70,000 | $185,990 |
| 2021 | $2,526 | $233,670 | $70,000 | $163,670 |
| 2020 | $2,670 | $218,790 | $70,000 | $148,790 |
| 2019 | $2,311 | $218,790 | $70,000 | $148,790 |
| 2018 | $2,396 | $203,920 | $42,000 | $161,920 |
| 2017 | $2,110 | $176,930 | $42,000 | $134,930 |
| 2016 | $2,079 | $176,930 | $42,000 | $134,930 |
| 2015 | $2,119 | $176,930 | $42,000 | $134,930 |
| 2014 | -- | $176,930 | $42,000 | $134,930 |
| 2013 | -- | $176,930 | $42,000 | $134,930 |
Source: Public Records
Map
Nearby Homes
- 2674 Eagle Watch Loop
- 2619 Eagle Watch Loop
- 2665 Maidstone St
- 2971 Sonoran Dr
- 2940 Sedona Cir
- 2730 Sawgrass Loop
- 2703 Sawgrass Loop
- The Bentley Plan at Quail Ridge at Horn Rapids
- The Carrington Plan at Quail Ridge at Horn Rapids
- The Sandoval Plan at Quail Ridge at Horn Rapids
- The Malone Plan at Quail Ridge at Horn Rapids
- The Tahoma Plan at Quail Ridge at Horn Rapids
- The Shasta Plan at Quail Ridge at Horn Rapids
- The Siskiyou Plan at Quail Ridge at Horn Rapids
- The Chase Plan at Quail Ridge at Horn Rapids
- The Hillmont Plan at Quail Ridge at Horn Rapids
- 2895 Sawgrass Loop
- 2539 Prestwick Dr
- 2793 Sawgrass Loop
- 3043 Bobwhite Way
- 2650 Torrey Pines Way Unit Single Level Home Re
- 2650 Torrey Pines Way
- 2654 Torrey Pines Way Unit Great Community and
- 2654 Torrey Pines Way Unit Peaceful Golf Course
- 2646 Torrey Pines Way
- 2646 Torrey Pines Way Unit Enjoy the Fantastic
- 2646 Torrey Pines Way Unit Beautiful 2-Story w/
- 2655 Sandpiper Loop
- 2651 Sandpiper Loop
- 2661 Sandpiper Loop
- 2640 Torrey Pines Way
- 2665 Sandpiper Loop
- 2645 Sandpiper Loop
- 2651 Torrey Pines Way
- 2645 Torrey Pines Way
- 2655 Torrey Pines Way
- 2639 Sandpiper Loop
- 2671 Sandpiper Loop
- 2641 Torrey Pines Way
- 2659 Torrey Pines Way