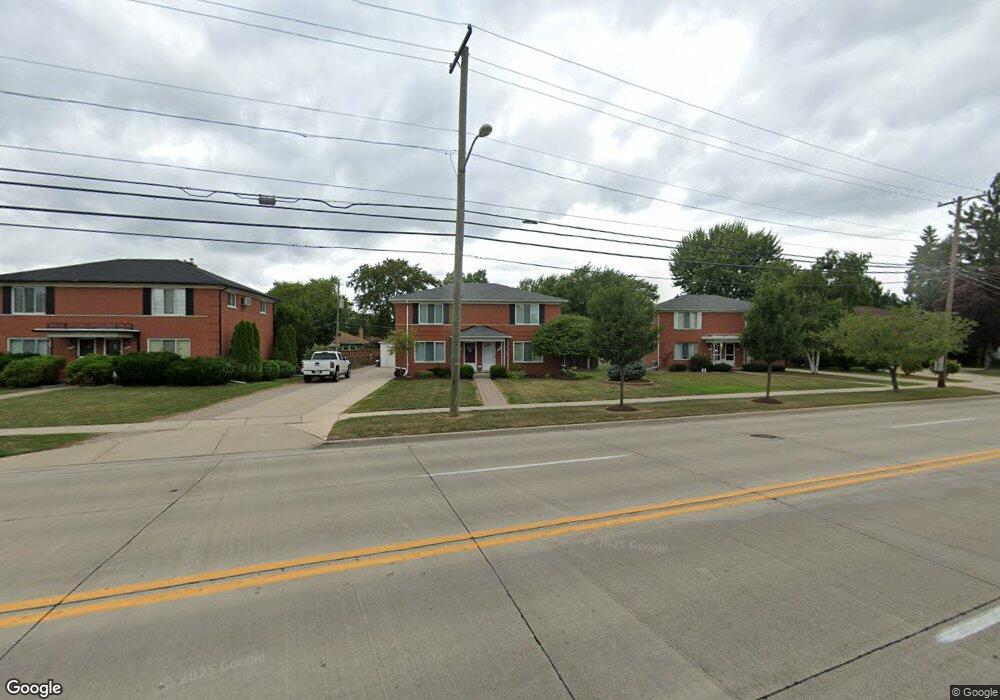
26509 Jefferson Ave Saint Clair Shores, MI 48081
Estimated Value: $282,385 - $533,000
2
Beds
2
Baths
1,100
Sq Ft
$328/Sq Ft
Est. Value
About This Home
This home is located at 26509 Jefferson Ave, Saint Clair Shores, MI 48081 and is currently estimated at $360,846, approximately $328 per square foot. 26509 Jefferson Ave is a home located in Macomb County with nearby schools including Lakeview High School and St. Isaac Jogues Elementary School.
Ownership History
Date
Name
Owned For
Owner Type
Purchase Details
Closed on
Mar 13, 2008
Sold by
Turner Hugo E
Bought by
Ht Jefferson Properties Inc
Current Estimated Value
Purchase Details
Closed on
Aug 12, 2005
Sold by
M T Materna Llc
Bought by
Turner Hugo E
Purchase Details
Closed on
Apr 6, 2005
Sold by
Materna Michael T and Materna Angeline
Bought by
M T Materna Llc
Purchase Details
Closed on
Nov 19, 2004
Sold by
Rizzo Charles P and Rizzo Marilyn D
Bought by
Materna Michael and Materna Angeline
Home Financials for this Owner
Home Financials are based on the most recent Mortgage that was taken out on this home.
Original Mortgage
$127,500
Interest Rate
5.62%
Mortgage Type
Purchase Money Mortgage
Purchase Details
Closed on
Jul 18, 2002
Sold by
Warnez Mary Ann Trust #1
Bought by
Rizzo Charles P
Create a Home Valuation Report for This Property
The Home Valuation Report is an in-depth analysis detailing your home's value as well as a comparison with similar homes in the area
Home Values in the Area
Average Home Value in this Area
Purchase History
| Date | Buyer | Sale Price | Title Company |
|---|---|---|---|
| Ht Jefferson Properties Inc | -- | None Available | |
| Turner Hugo E | $290,000 | Title One Inc | |
| M T Materna Llc | -- | -- | |
| Materna Michael | $255,000 | Great Lakes Title Of Mi | |
| Rizzo Charles P | $185,000 | -- |
Source: Public Records
Mortgage History
| Date | Status | Borrower | Loan Amount |
|---|---|---|---|
| Previous Owner | Materna Michael | $127,500 |
Source: Public Records
Tax History Compared to Growth
Tax History
| Year | Tax Paid | Tax Assessment Tax Assessment Total Assessment is a certain percentage of the fair market value that is determined by local assessors to be the total taxable value of land and additions on the property. | Land | Improvement |
|---|---|---|---|---|
| 2025 | $4,093 | $142,200 | $0 | $0 |
| 2024 | $4,093 | $139,300 | $0 | $0 |
| 2023 | $3,958 | $125,700 | $0 | $0 |
| 2022 | $3,757 | $109,900 | $0 | $0 |
| 2021 | $3,680 | $98,100 | $0 | $0 |
| 2020 | $3,675 | $95,400 | $0 | $0 |
| 2019 | $3,550 | $81,200 | $0 | $0 |
| 2018 | $3,486 | $71,100 | $0 | $0 |
| 2017 | $3,373 | $64,400 | $11,900 | $52,500 |
| 2016 | $3,141 | $64,400 | $0 | $0 |
| 2015 | $3,121 | $57,300 | $0 | $0 |
| 2012 | -- | $48,300 | $11,000 | $37,300 |
Source: Public Records
Map
Nearby Homes
- 22317 Bon Heur St
- 22011 Lakeshire St
- 22470 Wildwood St
- 22515 Wildwood St
- 22459 Daniels St
- 22301 Ardmore Park Dr
- 26314 E St
- 22631 Bayview Dr
- 26926 Koerber St
- 26918 Koerber St
- 22477 Ardmore Park Dr
- 22031 Statler St
- 403 Bon Brae Ct
- 21527 Bon Heur St
- 21717 Madison St
- 22676 Bayview Dr
- 21636 Lakeland St
- 22450 Alexander St
- 22546 Alexander St
- 21258 Bon Brae St
- 26517 Jefferson Ave
- 26501 Jefferson Ave
- 26529 Jefferson Ave
- 26521 Jefferson Ave
- 26513 Jefferson Ave
- 22325 Frazho St
- 22329 Frazho St
- 22321 Frazho St
- 26525 Jefferson Ave
- 22313 Frazho St
- 26520 Jefferson Ave
- 26425 Jefferson Ave
- 22320 Lakeshire St
- 26607 Jefferson Ave
- 22305 Lakeshire St
- 26528 Jefferson Ave
- 26401 Jefferson Ave
- 22312 Lakeshire St
- 22309 Frazho St
- 26613 Jefferson Ave