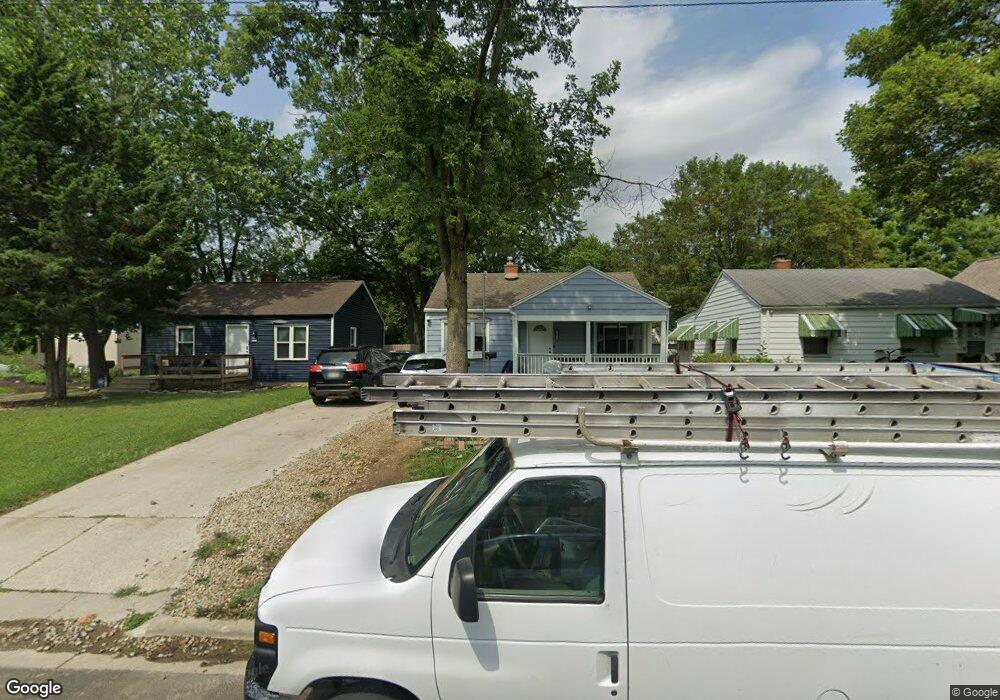
2651 Audubon Rd Columbus, OH 43211
North Linden NeighborhoodEstimated Value: $124,000 - $177,000
3
Beds
1
Bath
1,008
Sq Ft
$152/Sq Ft
Est. Value
About This Home
This home is located at 2651 Audubon Rd, Columbus, OH 43211 and is currently estimated at $153,193, approximately $151 per square foot. 2651 Audubon Rd is a home located in Franklin County with nearby schools including Como Elementary School, Dominion Middle School, and Whetstone High School.
Ownership History
Date
Name
Owned For
Owner Type
Purchase Details
Closed on
Sep 11, 2023
Sold by
Scarlet And Gray Holdings Llc
Bought by
J & E Drywall Llc
Current Estimated Value
Home Financials for this Owner
Home Financials are based on the most recent Mortgage that was taken out on this home.
Original Mortgage
$105,188
Interest Rate
7.09%
Mortgage Type
Credit Line Revolving
Purchase Details
Closed on
Jun 8, 2010
Sold by
Roberts Cynthia J and Avakian Carol S
Bought by
Heck Daniel L and Heck Catherine M
Home Financials for this Owner
Home Financials are based on the most recent Mortgage that was taken out on this home.
Original Mortgage
$27,300
Interest Rate
5.13%
Mortgage Type
New Conventional
Purchase Details
Closed on
Dec 15, 2006
Sold by
Lombardi Marjorie L
Bought by
Roberts Cynthia J and Avakian Carol S
Purchase Details
Closed on
Jul 3, 2002
Sold by
Estate Of Nicholas J Lombardi
Bought by
Lombardi Marjorie L
Create a Home Valuation Report for This Property
The Home Valuation Report is an in-depth analysis detailing your home's value as well as a comparison with similar homes in the area
Home Values in the Area
Average Home Value in this Area
Purchase History
| Date | Buyer | Sale Price | Title Company |
|---|---|---|---|
| J & E Drywall Llc | $127,500 | Columbus Title | |
| Scarlet And Gray Holdings Llc | $113,000 | Columbus Title | |
| Heck Daniel L | $42,000 | Talon Group | |
| Roberts Cynthia J | -- | Attorney | |
| Lombardi Marjorie L | -- | -- |
Source: Public Records
Mortgage History
| Date | Status | Borrower | Loan Amount |
|---|---|---|---|
| Closed | J & E Drywall Llc | $105,188 | |
| Previous Owner | Heck Daniel L | $27,300 |
Source: Public Records
Tax History Compared to Growth
Tax History
| Year | Tax Paid | Tax Assessment Tax Assessment Total Assessment is a certain percentage of the fair market value that is determined by local assessors to be the total taxable value of land and additions on the property. | Land | Improvement |
|---|---|---|---|---|
| 2024 | $2,099 | $42,530 | $9,870 | $32,660 |
| 2023 | $1,925 | $42,530 | $9,870 | $32,660 |
| 2022 | $1,213 | $22,820 | $5,390 | $17,430 |
| 2021 | $1,215 | $22,820 | $5,390 | $17,430 |
| 2020 | $1,217 | $22,820 | $5,390 | $17,430 |
| 2019 | $1,191 | $19,150 | $4,690 | $14,460 |
| 2018 | $1,103 | $19,150 | $4,690 | $14,460 |
| 2017 | $1,191 | $19,150 | $4,690 | $14,460 |
| 2016 | $1,118 | $16,460 | $3,890 | $12,570 |
| 2015 | $1,018 | $16,460 | $3,890 | $12,570 |
| 2014 | $1,021 | $16,460 | $3,890 | $12,570 |
| 2013 | $592 | $19,355 | $4,585 | $14,770 |
Source: Public Records
Map
Nearby Homes
- 2623 Audubon Rd
- 2661 Osceola Ave
- 2725 Homecroft Dr
- 2751 Pontiac St
- 2765 Pontiac St
- 2544 Azelda St
- 2487 Azelda St
- 2767 Hiawatha St
- 775 E Weber Rd
- 2810-2812 Azelda St
- 2816 Azelda St
- 580 Crestview Rd
- 2654 Howey Rd
- 2595 Grasmere Ave
- 2389 Hiawatha Park Dr Unit 391
- 2783 Howey Rd
- 2383 Hiawatha Park Dr Unit 2385
- 2634 Grasmere Ave
- 2696 Grasmere Ave
- 2390 Atwood Terrace
- 2657 Audubon Rd
- 2645 Audubon Rd
- 2661 Audubon Rd
- 744 Arlington Ave
- 2667 Audubon Rd
- 2633 Audubon Rd
- 740 Arlington Ave
- 2673 Audubon Rd
- 2629 Audubon Rd
- 734 Arlington Ave
- 2648 Audubon Rd
- 2654 Audubon Rd
- 2642 Audubon Rd
- 743 Arlington Ave
- 2660 Audubon Rd
- 753 Edgar Place
- 2636 Audubon Rd
- 2664 Audubon Rd
- 737 Arlington Ave
- 747 Edgar Place