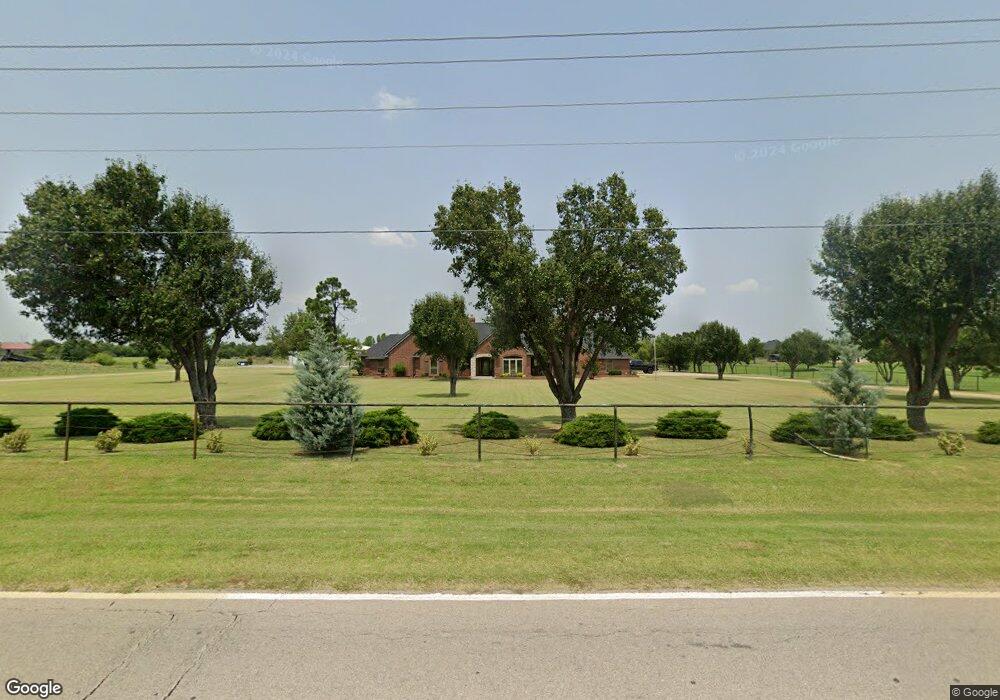
2651 NW 206th St Edmond, OK 73012
West Edmond NeighborhoodEstimated Value: $603,000 - $905,000
3
Beds
2
Baths
3,075
Sq Ft
$236/Sq Ft
Est. Value
About This Home
This home is located at 2651 NW 206th St, Edmond, OK 73012 and is currently estimated at $724,882, approximately $235 per square foot. 2651 NW 206th St is a home located in Oklahoma County with nearby schools including Prairie Vale Elementary School, Deer Creek Middle School, and Deer Creek Intermediate School.
Ownership History
Date
Name
Owned For
Owner Type
Purchase Details
Closed on
May 7, 2010
Sold by
Doug R and Doug Jennifer Ann
Bought by
Feinberg James D and Feinberg Diane D
Current Estimated Value
Purchase Details
Closed on
Aug 11, 2005
Sold by
Hasselwander Doug R and Hasselwander Jennifer A
Bought by
Revoc Doug R and Revoc Jennifer Ann Hasselwander
Purchase Details
Closed on
May 31, 2002
Sold by
Willingham Robert Arthur and Willingham Sheryl Kay
Bought by
Willingham Robert Arthur and Willingham Sheryl Kay
Purchase Details
Closed on
May 8, 2002
Sold by
Willingham Robert Arthur and Willingham Sheryl K
Bought by
Hasselwander Doug R and Hasselwander Jennifer A
Purchase Details
Closed on
Jan 19, 1998
Sold by
Willingham Robert A and Willingham Sheryl K
Bought by
Willingham Robert Arthur and Willingham Sheryl Kay
Create a Home Valuation Report for This Property
The Home Valuation Report is an in-depth analysis detailing your home's value as well as a comparison with similar homes in the area
Home Values in the Area
Average Home Value in this Area
Purchase History
| Date | Buyer | Sale Price | Title Company |
|---|---|---|---|
| Feinberg James D | $425,000 | Capitol Abstract & Title Co | |
| Revoc Doug R | -- | -- | |
| Willingham Robert Arthur | -- | Oklahoma City Abstract & Tit | |
| Hasselwander Doug R | $345,000 | Stewart Abstract & Title | |
| Willingham Robert Arthur | -- | -- | |
| Willingham Robert Arthur | -- | -- |
Source: Public Records
Tax History Compared to Growth
Tax History
| Year | Tax Paid | Tax Assessment Tax Assessment Total Assessment is a certain percentage of the fair market value that is determined by local assessors to be the total taxable value of land and additions on the property. | Land | Improvement |
|---|---|---|---|---|
| 2024 | $6,795 | $57,378 | $3,751 | $53,627 |
| 2023 | $6,795 | $55,707 | $3,776 | $51,931 |
| 2022 | $6,095 | $54,084 | $4,578 | $49,506 |
| 2021 | $5,815 | $52,509 | $4,754 | $47,755 |
| 2020 | $6,233 | $50,980 | $4,481 | $46,499 |
| 2019 | $361 | $49,495 | $4,919 | $44,576 |
| 2018 | $351 | $48,054 | $0 | $0 |
| 2017 | $341 | $46,653 | $4,947 | $41,706 |
| 2016 | $5,570 | $45,294 | $5,160 | $40,134 |
| 2015 | $4,958 | $43,976 | $5,786 | $38,190 |
| 2014 | $4,861 | $42,695 | $5,903 | $36,792 |
Source: Public Records
Map
Nearby Homes
- 20897 Highlander Ridge Dr
- 20960 Highlander Ridge Dr
- 2377 NW 206th St
- 21070 Highlander Ridge Dr
- 20300 Tranquil Pasture Ln
- 20135 Antler Farms Dr
- 19813 Brunswick Ct
- 21687 Coffee Tree Cir
- 20796 Alba Ct
- 19728 Canning Rd
- 19704 Forsythe Dr
- 19712 Brookville Dr
- 2528 NW 197th Terrace
- 2521 NW 196th St
- 19616 Bolton Rd
- 2317 NW 198th St
- 2529 NW 196th St
- 2341 NW 197th St
- 2525 NW 196th St
- 2524 NW 196th St
- 2633 NW 206th St
- 20853 Cortona Dr
- 20800 Cortona Dr
- 21005 Cortona Dr
- 20963 Cortona Dr
- 2601 NW 206th St
- 2825 NW 206th St
- 2721 NW 206th St
- 20864 Cortona Dr
- 20940 Cortona Dr
- 2644 W Mission Springs Dr
- 2616 W Mission Springs Dr
- 20741 Highlander Ridge Dr
- 20811 Highlander Ridge Dr
- 2708 W Mission Springs Dr
- 2588 W Mission Springs Dr
- 20980 Cortona Dr
- 20853 Highlander Ridge Dr
- 2766 W Mission Springs Dr
- 2576 W Mission Springs Dr