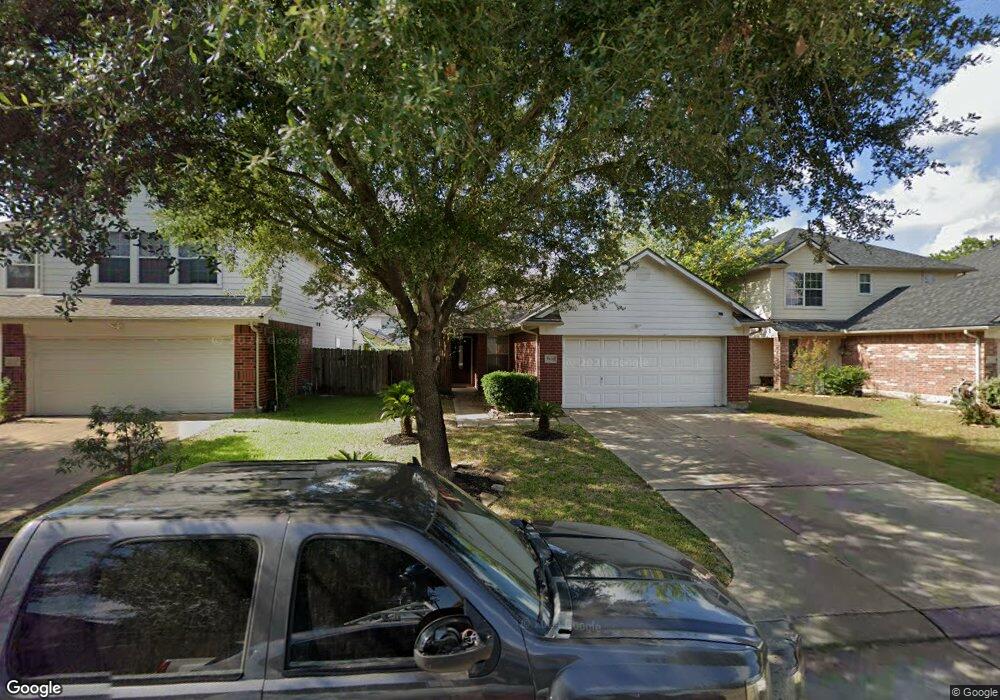
2651 Royal Blue Dr Houston, TX 77088
North Houston NeighborhoodEstimated Value: $218,219 - $247,000
4
Beds
2
Baths
1,314
Sq Ft
$174/Sq Ft
Est. Value
About This Home
This home is located at 2651 Royal Blue Dr, Houston, TX 77088 and is currently estimated at $229,055, approximately $174 per square foot. 2651 Royal Blue Dr is a home located in Harris County with nearby schools including Hill Intermediate School, Stovall School, and Carmichael Elementary School.
Ownership History
Date
Name
Owned For
Owner Type
Purchase Details
Closed on
Jun 12, 2009
Sold by
Secretary Of Housing & Urban Development
Bought by
Smith Jackie
Current Estimated Value
Home Financials for this Owner
Home Financials are based on the most recent Mortgage that was taken out on this home.
Original Mortgage
$76,587
Outstanding Balance
$48,206
Interest Rate
4.7%
Mortgage Type
FHA
Estimated Equity
$180,849
Purchase Details
Closed on
Feb 11, 2009
Sold by
Wells Fargo Bank Na
Bought by
The Secretary Of Housing & Urban Develop
Purchase Details
Closed on
Feb 3, 2009
Sold by
Jackson Sterling and Taylor Joy
Bought by
Wells Fargo Bank Na
Purchase Details
Closed on
Aug 31, 2006
Sold by
Nuhome Of Texas
Bought by
Taylor Joy and Jackson Sterling
Home Financials for this Owner
Home Financials are based on the most recent Mortgage that was taken out on this home.
Original Mortgage
$109,721
Interest Rate
6.79%
Mortgage Type
FHA
Create a Home Valuation Report for This Property
The Home Valuation Report is an in-depth analysis detailing your home's value as well as a comparison with similar homes in the area
Home Values in the Area
Average Home Value in this Area
Purchase History
| Date | Buyer | Sale Price | Title Company |
|---|---|---|---|
| Smith Jackie | -- | None Available | |
| The Secretary Of Housing & Urban Develop | -- | None Available | |
| Wells Fargo Bank Na | $120,173 | None Available | |
| Taylor Joy | -- | North American Title Co | |
| Lennar Homes Of Texas Sales & Mktg Ltd | -- | North American Title Co |
Source: Public Records
Mortgage History
| Date | Status | Borrower | Loan Amount |
|---|---|---|---|
| Open | Smith Jackie | $76,587 | |
| Previous Owner | Taylor Joy | $109,721 |
Source: Public Records
Tax History Compared to Growth
Tax History
| Year | Tax Paid | Tax Assessment Tax Assessment Total Assessment is a certain percentage of the fair market value that is determined by local assessors to be the total taxable value of land and additions on the property. | Land | Improvement |
|---|---|---|---|---|
| 2025 | $1,237 | $205,149 | $44,763 | $160,386 |
| 2024 | $1,237 | $205,149 | $44,763 | $160,386 |
| 2023 | $1,237 | $217,979 | $44,763 | $173,216 |
| 2022 | $4,342 | $187,400 | $26,257 | $161,143 |
| 2021 | $4,103 | $156,882 | $26,257 | $130,625 |
| 2020 | $4,012 | $144,227 | $26,257 | $117,970 |
| 2019 | $3,866 | $133,353 | $25,007 | $108,346 |
| 2018 | $1,141 | $128,543 | $25,007 | $103,536 |
| 2017 | $3,209 | $128,543 | $25,007 | $103,536 |
| 2016 | $2,918 | $113,950 | $18,005 | $95,945 |
| 2015 | $2,201 | $113,950 | $18,005 | $95,945 |
| 2014 | $2,201 | $99,051 | $18,005 | $81,046 |
Source: Public Records
Map
Nearby Homes
- 2634 Royal Blue Dr
- 2647 Royal Thistle Dr
- 11422 Royal Thistle Ct
- 2734 Donellan Dr
- 2762 Donellan Dr
- 10923 Whistlers Cottage Ct
- 10911 Camarillo Ct
- 2507 Estaril Cir
- 2846 W Mount Houston Rd
- 11207 Royal Rock Ct
- 2845 Washington Dr
- 2422 Fallen Pine Ln
- 2418 Fallen Pine Ln
- 2415 Fallen Pine Ln
- 9218 Washington Dr
- 9217 Washington Dr
- 9206 Washington Dr
- 11618 Wren Crossing Dr
- 10642 Logger Pine Trail Unit B
- 10634 Logger Pine Trail
- 2655 Royal Blue Dr
- 2659 Royal Blue Dr
- 2647 Royal Blue Dr
- 2663 Royal Blue Dr
- 2650 Royal Blue Dr
- 2654 Royal Blue Dr
- 2646 Royal Blue Dr
- 2643 Royal Blue Dr
- 2626 Royal Sage Dr
- 2658 Royal Blue Dr
- 2630 Royal Sage Dr
- 2667 Royal Blue Dr
- 2639 Royal Blue Dr
- 2642 Royal Blue Dr
- 2622 Royal Sage Dr
- 2618 Royal Sage Dr
- 2614 Royal Sage Dr
- 2662 Royal Blue Dr
- 2634 Royal Sage Dr
- 2638 Royal Blue Dr