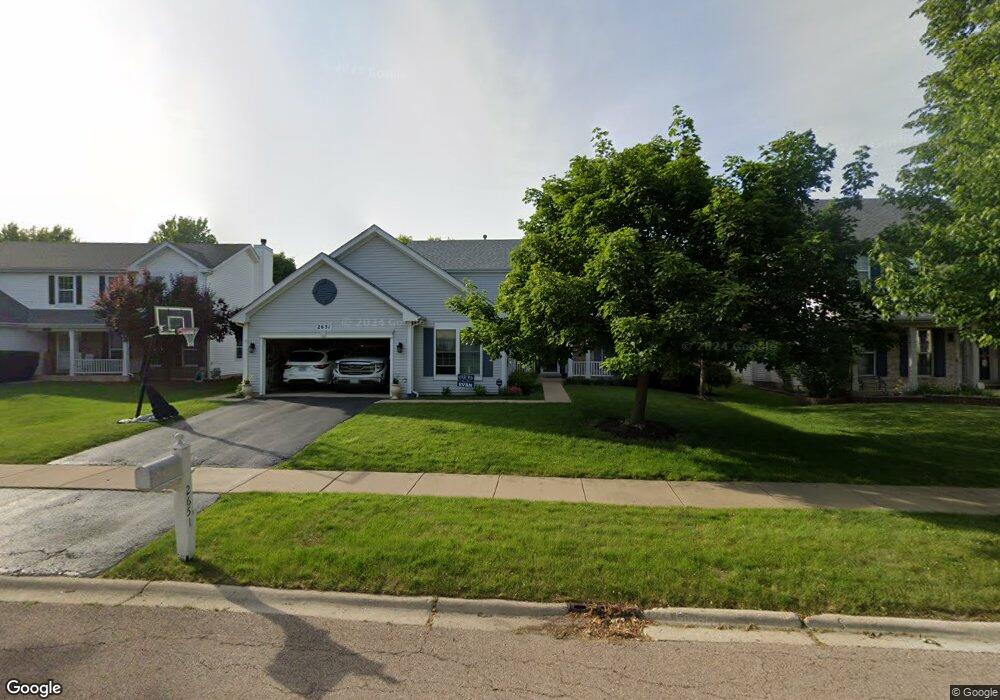
2651 Sagamore Cir Aurora, IL 60503
Far Southeast NeighborhoodEstimated Value: $490,000 - $535,000
5
Beds
3
Baths
3,202
Sq Ft
$162/Sq Ft
Est. Value
About This Home
This home is located at 2651 Sagamore Cir, Aurora, IL 60503 and is currently estimated at $517,673, approximately $161 per square foot. 2651 Sagamore Cir is a home located in Will County with nearby schools including Wolfs Crossing Elementary School, Bednarcik Jr. High School, and Oswego East High School.
Ownership History
Date
Name
Owned For
Owner Type
Purchase Details
Closed on
Oct 26, 2009
Sold by
Madigan Michele
Bought by
Owings Andrew C and Owings Natalie M
Current Estimated Value
Home Financials for this Owner
Home Financials are based on the most recent Mortgage that was taken out on this home.
Original Mortgage
$252,000
Outstanding Balance
$165,134
Interest Rate
5.07%
Mortgage Type
New Conventional
Estimated Equity
$352,539
Purchase Details
Closed on
Aug 17, 1999
Sold by
Lakewood Valley Llc
Bought by
Madigan Michele
Home Financials for this Owner
Home Financials are based on the most recent Mortgage that was taken out on this home.
Original Mortgage
$236,950
Interest Rate
7.61%
Create a Home Valuation Report for This Property
The Home Valuation Report is an in-depth analysis detailing your home's value as well as a comparison with similar homes in the area
Home Values in the Area
Average Home Value in this Area
Purchase History
| Date | Buyer | Sale Price | Title Company |
|---|---|---|---|
| Owings Andrew C | $280,000 | Ticor | |
| Madigan Michele | $249,500 | Chicago Title Insurance Co |
Source: Public Records
Mortgage History
| Date | Status | Borrower | Loan Amount |
|---|---|---|---|
| Open | Owings Andrew C | $252,000 | |
| Previous Owner | Madigan Michele | $236,950 |
Source: Public Records
Tax History
| Year | Tax Paid | Tax Assessment Tax Assessment Total Assessment is a certain percentage of the fair market value that is determined by local assessors to be the total taxable value of land and additions on the property. | Land | Improvement |
|---|---|---|---|---|
| 2024 | $12,786 | $154,686 | $23,259 | $131,427 |
| 2023 | $12,786 | $136,649 | $20,547 | $116,102 |
| 2022 | $10,723 | $113,752 | $19,437 | $94,315 |
| 2021 | $10,660 | $108,335 | $18,511 | $89,824 |
| 2020 | $10,206 | $106,619 | $18,218 | $88,401 |
| 2019 | $10,315 | $103,615 | $17,705 | $85,910 |
| 2018 | $9,840 | $95,938 | $17,315 | $78,623 |
| 2017 | $9,739 | $93,461 | $16,868 | $76,593 |
| 2016 | $9,986 | $91,449 | $16,505 | $74,944 |
| 2015 | $9,894 | $87,932 | $15,870 | $72,062 |
| 2014 | $9,894 | $81,410 | $15,870 | $65,540 |
| 2013 | $9,894 | $81,410 | $15,870 | $65,540 |
Source: Public Records
Map
Nearby Homes
- 2503 Bayhill Ct
- 2812 Stuart Kaplan Ct
- 10140 S Eola Rd
- 2969 Francis Ct
- 2327 Georgetown Cir Unit 18/4
- 2662 Lahinch Dr
- 2722 Lahinch Dr
- 9623 S Carls Dr
- 2413 Dickens Dr
- 2513 Dickens Dr
- 2735 Hillsboro Blvd Unit 3
- 2723 Hillsboro Blvd
- 9836 S Carls Dr
- 2255 Georgetown Cir
- 2263 Shiloh Dr Unit 2
- 2125 Sunrise Cir Unit 27
- 2598 Hillsboro Blvd
- 2156 Sunrise Cir
- 2495 Hafenrichter Rd
- 2197 Wilson Creek Cir Unit 3
- 2641 Sagamore Cir
- 2655 Sagamore Cir
- 2578 Imperial Valley Trail
- 2588 Imperial Valley Trail
- 2661 Sagamore Cir
- 2631 Sagamore Cir
- 2568 Imperial Valley Trail
- 2581 Sagamore Cir
- 2598 Imperial Valley Trail
- 2652 Sagamore Cir
- 2632 Sagamore Cir
- 2671 Sagamore Cir
- 2571 Sagamore Cir
- 2558 Imperial Valley Trail
- 2662 Sagamore Cir
- 2608 Imperial Valley Trail
- 2622 Sagamore Cir
- 2548 Imperial Valley Trail
- 2672 Sagamore Cir
- 2620 Imperial Valley Trail
Your Personal Tour Guide
Ask me questions while you tour the home.