Estimated Value: $292,000 - $331,000
3
Beds
3
Baths
1,754
Sq Ft
$174/Sq Ft
Est. Value
About This Home
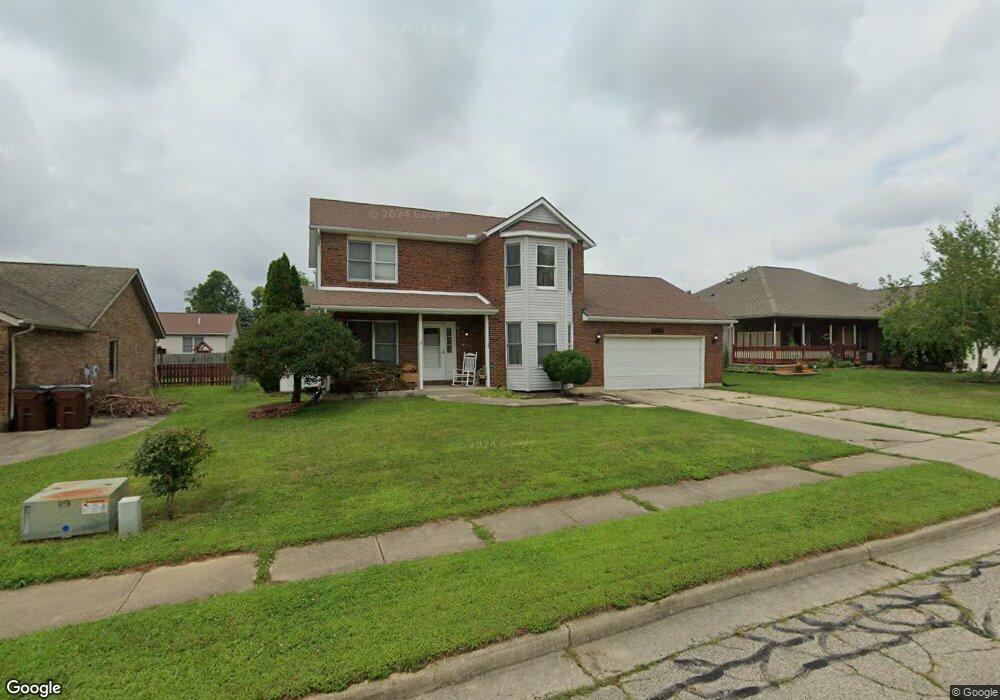
This home is located at 2652 Childers Dr, Xenia, OH 45385 and is currently estimated at $305,014, approximately $173 per square foot. 2652 Childers Dr is a home located in Greene County with nearby schools including Xenia High School and Summit Academy Community School for Alternative Learners - Xenia.
Ownership History
Date
Name
Owned For
Owner Type
Purchase Details
Closed on
Apr 6, 2015
Sold by
Bistrek Christopher B
Bought by
Bistrek Cynthia M
Current Estimated Value
Purchase Details
Closed on
Aug 27, 2003
Sold by
Cly Geoffrey C and Cly Marsha A
Bought by
Bistrek Christopher B and Bistrek Cynthia M
Home Financials for this Owner
Home Financials are based on the most recent Mortgage that was taken out on this home.
Original Mortgage
$128,000
Outstanding Balance
$59,134
Interest Rate
6.18%
Mortgage Type
Unknown
Estimated Equity
$245,880
Purchase Details
Closed on
May 3, 1996
Sold by
Conner Michael D
Bought by
Cly Geoggrey C and Cly A
Home Financials for this Owner
Home Financials are based on the most recent Mortgage that was taken out on this home.
Original Mortgage
$121,600
Interest Rate
5.5%
Mortgage Type
New Conventional
Create a Home Valuation Report for This Property
The Home Valuation Report is an in-depth analysis detailing your home's value as well as a comparison with similar homes in the area
Home Values in the Area
Average Home Value in this Area
Purchase History
| Date | Buyer | Sale Price | Title Company |
|---|---|---|---|
| Bistrek Cynthia M | -- | Hallmark Title | |
| Bistrek Christopher B | $320,000 | -- | |
| Cly Geoggrey C | $128,000 | -- |
Source: Public Records
Mortgage History
| Date | Status | Borrower | Loan Amount |
|---|---|---|---|
| Open | Bistrek Christopher B | $128,000 | |
| Closed | Cly Geoggrey C | $121,600 |
Source: Public Records
Tax History Compared to Growth
Tax History
| Year | Tax Paid | Tax Assessment Tax Assessment Total Assessment is a certain percentage of the fair market value that is determined by local assessors to be the total taxable value of land and additions on the property. | Land | Improvement |
|---|---|---|---|---|
| 2024 | $3,492 | $81,600 | $16,640 | $64,960 |
| 2023 | $3,492 | $81,600 | $16,640 | $64,960 |
| 2022 | $3,091 | $61,610 | $11,100 | $50,510 |
| 2021 | $3,132 | $61,610 | $11,100 | $50,510 |
| 2020 | $3,001 | $61,610 | $11,100 | $50,510 |
| 2019 | $2,564 | $49,550 | $8,760 | $40,790 |
| 2018 | $2,574 | $49,550 | $8,760 | $40,790 |
| 2017 | $2,514 | $49,550 | $8,760 | $40,790 |
| 2016 | $2,514 | $47,490 | $8,760 | $38,730 |
| 2015 | $2,454 | $47,490 | $8,760 | $38,730 |
| 2014 | $2,347 | $47,490 | $8,760 | $38,730 |
Source: Public Records
Map
Nearby Homes
- 1213 Prem Place
- 1248 Prem Place
- 1161 Shannon Ln
- 1318 Prem Place
- 2345 Tennessee Dr
- 0 Berkshire Dr Unit 942854
- 2784 Greystoke Dr
- 1358 Shannon Ln
- 2421 Louisiana Dr
- 2540 Jenny Marie Dr
- 1304 Baybury Ave
- 1298 Baybury Ave
- 1282 Baybury Ave
- 2821 Raxit Ct
- 2540 Cornwall Dr
- 2499 Jenny Marie Dr
- 1293 Baybury Ave
- 1272 Baybury Ave
- 1292 Baybury Ave
- 2257 Maryland Dr
- 2644 Childers Dr
- 2660 Childers Dr
- 2651 Tennessee Dr
- 2643 Tennessee Dr
- 2659 Tennessee Dr
- 2636 Childers Dr
- 2668 Childers Dr
- 2665 Childers Dr
- 2635 Tennessee Dr
- 2667 Tennessee Dr
- 2639 Childers Dr
- 2628 Childers Dr
- 2676 Childers Dr
- 2627 Tennessee Dr
- 2629 Childers Dr
- 1154 Arlie Ct
- 2675 Tennessee Dr
- 1155 Arlie Ct
- 2650 Tennessee Dr
- 2642 Tennessee Dr