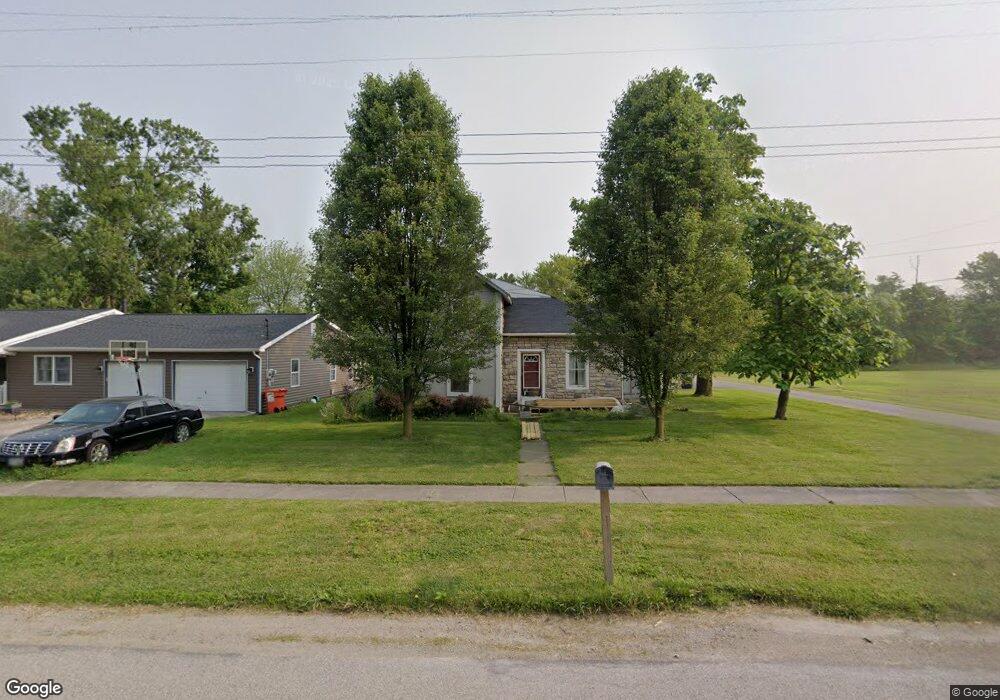
2652 Collins Rd Collins, OH 44826
Estimated Value: $62,821 - $194,000
3
Beds
1
Bath
1,276
Sq Ft
$106/Sq Ft
Est. Value
About This Home
This home is located at 2652 Collins Rd, Collins, OH 44826 and is currently estimated at $135,455, approximately $106 per square foot. 2652 Collins Rd is a home located in Huron County with nearby schools including Western Reserve Elementary School, Western Reserve Middle School, and Western Reserve High School.
Ownership History
Date
Name
Owned For
Owner Type
Purchase Details
Closed on
Sep 2, 2021
Sold by
Rife William H and Rife Sandra E
Bought by
Long Alexandra B
Current Estimated Value
Home Financials for this Owner
Home Financials are based on the most recent Mortgage that was taken out on this home.
Original Mortgage
$35,000
Outstanding Balance
$31,568
Interest Rate
2.8%
Mortgage Type
New Conventional
Estimated Equity
$103,887
Purchase Details
Closed on
Jan 31, 2005
Bought by
Wells Fargo Minnesota and Rife Andra
Purchase Details
Closed on
Jun 24, 1994
Sold by
Manhart Ed
Bought by
Manhart Michael and Manhart Kathy
Home Financials for this Owner
Home Financials are based on the most recent Mortgage that was taken out on this home.
Original Mortgage
$33,218
Interest Rate
8.78%
Mortgage Type
New Conventional
Create a Home Valuation Report for This Property
The Home Valuation Report is an in-depth analysis detailing your home's value as well as a comparison with similar homes in the area
Purchase History
| Date | Buyer | Sale Price | Title Company |
|---|---|---|---|
| Long Alexandra B | $50,000 | Chicago Title | |
| Wells Fargo Minnesota | $20,000 | -- | |
| Manhart Michael | $15,834 | -- | |
| Manhart Michael J | $15,800 | -- |
Source: Public Records
Mortgage History
| Date | Status | Borrower | Loan Amount |
|---|---|---|---|
| Open | Long Alexandra B | $35,000 | |
| Previous Owner | Manhart Michael J | $33,218 |
Source: Public Records
Tax History
| Year | Tax Paid | Tax Assessment Tax Assessment Total Assessment is a certain percentage of the fair market value that is determined by local assessors to be the total taxable value of land and additions on the property. | Land | Improvement |
|---|---|---|---|---|
| 2024 | $782 | $22,040 | $3,090 | $18,950 |
| 2023 | $780 | $19,840 | $2,130 | $17,710 |
| 2022 | $734 | $19,840 | $2,130 | $17,710 |
| 2021 | $756 | $19,840 | $2,130 | $17,710 |
| 2020 | $785 | $19,200 | $1,600 | $17,600 |
| 2019 | $782 | $19,200 | $1,600 | $17,600 |
| 2018 | $774 | $19,200 | $1,600 | $17,600 |
| 2017 | $707 | $17,810 | $1,600 | $16,210 |
| 2016 | $696 | $17,810 | $1,600 | $16,210 |
| 2015 | $690 | $17,810 | $1,600 | $16,210 |
| 2014 | $672 | $16,840 | $1,610 | $15,230 |
| 2013 | $613 | $16,840 | $1,610 | $15,230 |
Source: Public Records
Map
Nearby Homes
- 3876 Townsend Angling Rd
- 13701 Andress Rd
- 4775 State Route 601
- 101 South St
- 117 Millwood Ln
- 4 Valleyview St
- 500 State Route 61
- 86 Center St
- 29 5th St
- V/L 258 Stony Brook Ln
- V/L 260 Stony Brook Ln
- 50 Center St
- 42 Stony Brook Ln
- V/L 283 Stony Brook Ln
- V/L 284 Stony Brook Ln
- 19 South St
- 29 Stony Brook Ln
- 258 Stony Brook Ln
- 0 Stony Brook Ln
- 284 Stony Brook Ln
- 2662 Collins Rd
- 2648 Collins Rd
- 2636 Collins Rd
- 2628 Collins Rd
- 3 Walnut St
- 4466 Walnut St
- 4466 Walnut St
- 2594 Collins Rd
- 2620 Collins Rd
- 2621 N Railroad St
- 4452 Church St
- 4479 Walnut St
- 2608 Collins Rd
- 2706 Collins Rd
- 4463 Walnut St
- 4476 Church St
- 4476 Church St
- 2605 Collins Rd
- 2712 N Railroad St
- 2716 N Railroad St
Your Personal Tour Guide
Ask me questions while you tour the home.