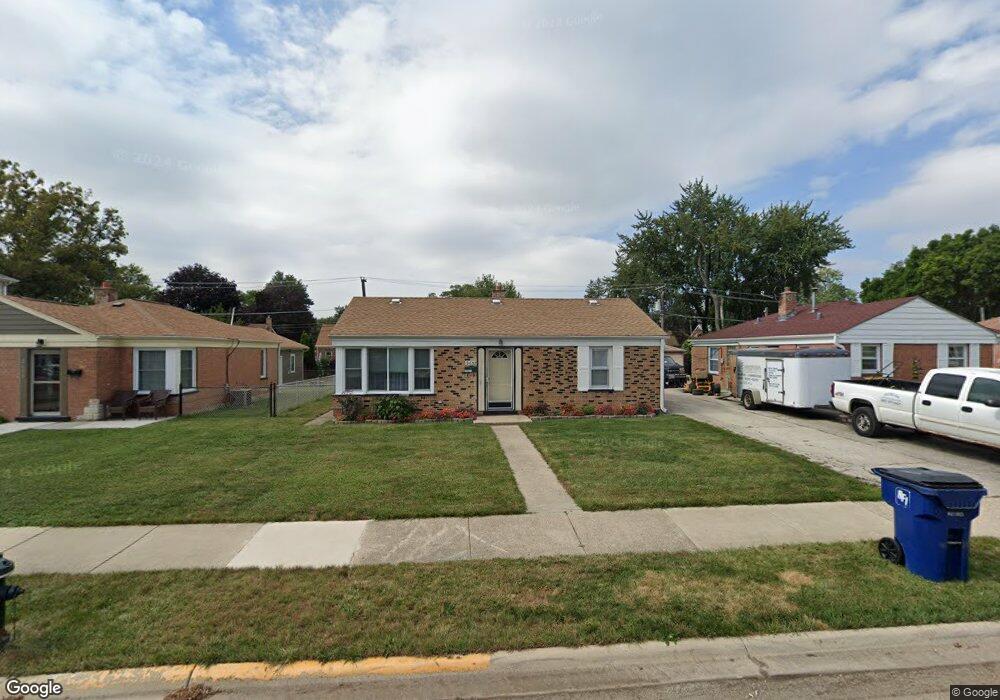
2652 Reuter St Franklin Park, IL 60131
Estimated Value: $276,000 - $299,857
2
Beds
1
Bath
864
Sq Ft
$337/Sq Ft
Est. Value
About This Home
This home is located at 2652 Reuter St, Franklin Park, IL 60131 and is currently estimated at $290,964, approximately $336 per square foot. 2652 Reuter St is a home located in Cook County with nearby schools including Passow Elementary School, Hester Jr High School, and East Leyden High School.
Ownership History
Date
Name
Owned For
Owner Type
Purchase Details
Closed on
Apr 29, 2003
Sold by
Hadzic Suada and Hadzic Ismet
Bought by
Porcic Zuhdija and Porcic Fata
Current Estimated Value
Home Financials for this Owner
Home Financials are based on the most recent Mortgage that was taken out on this home.
Original Mortgage
$169,750
Interest Rate
5.36%
Mortgage Type
Unknown
Purchase Details
Closed on
Jul 31, 2001
Sold by
Affarano Steven R and Affarano Elizabeth J
Bought by
Hadzic Ismet and Hadzic Suada
Home Financials for this Owner
Home Financials are based on the most recent Mortgage that was taken out on this home.
Original Mortgage
$119,900
Interest Rate
7.23%
Purchase Details
Closed on
May 29, 1997
Sold by
Fung Kit Ying
Bought by
Affarano Steven R and Affarano Elizabeth J
Home Financials for this Owner
Home Financials are based on the most recent Mortgage that was taken out on this home.
Original Mortgage
$110,481
Interest Rate
8.17%
Mortgage Type
FHA
Create a Home Valuation Report for This Property
The Home Valuation Report is an in-depth analysis detailing your home's value as well as a comparison with similar homes in the area
Home Values in the Area
Average Home Value in this Area
Purchase History
| Date | Buyer | Sale Price | Title Company |
|---|---|---|---|
| Porcic Zuhdija | $175,000 | Pntn | |
| Hadzic Ismet | $150,000 | -- | |
| Affarano Steven R | $112,500 | -- |
Source: Public Records
Mortgage History
| Date | Status | Borrower | Loan Amount |
|---|---|---|---|
| Previous Owner | Porcic Zuhdija | $169,750 | |
| Previous Owner | Hadzic Ismet | $119,900 | |
| Previous Owner | Affarano Steven R | $110,481 |
Source: Public Records
Tax History Compared to Growth
Tax History
| Year | Tax Paid | Tax Assessment Tax Assessment Total Assessment is a certain percentage of the fair market value that is determined by local assessors to be the total taxable value of land and additions on the property. | Land | Improvement |
|---|---|---|---|---|
| 2024 | $5,049 | $20,000 | $5,156 | $14,844 |
| 2023 | $5,200 | $20,000 | $5,156 | $14,844 |
| 2022 | $5,200 | $20,000 | $5,156 | $14,844 |
| 2021 | $3,645 | $12,646 | $4,125 | $8,521 |
| 2020 | $3,555 | $12,646 | $4,125 | $8,521 |
| 2019 | $3,709 | $14,242 | $4,125 | $10,117 |
| 2018 | $4,920 | $15,800 | $3,437 | $12,363 |
| 2017 | $4,872 | $15,800 | $3,437 | $12,363 |
| 2016 | $4,856 | $15,800 | $3,437 | $12,363 |
| 2015 | $4,567 | $14,452 | $3,093 | $11,359 |
| 2014 | $4,472 | $14,452 | $3,093 | $11,359 |
| 2013 | $4,116 | $14,452 | $3,093 | $11,359 |
Source: Public Records
Map
Nearby Homes
- 9727 Johanna Ave
- 2807 Elder Ln
- 2632 Westbrook Dr
- 2829 Elder Ln
- 2749 Scott St
- 2843 Hawthorne St
- 2526 Rose St
- 9907 W Fullerton Ave
- 10131 Nevada Ave
- 2920 Sarah St
- 2520 Dora St
- 10115 Belden Ave
- 3046 Sarah St
- 3137 Sunset Ln
- 2628 Willow St
- 3321 Ruby St
- 9146 Grand Ave Unit 1SE
- 2641 Oak St
- 10213 W Lyndale Ave
- 2038 Ruby St