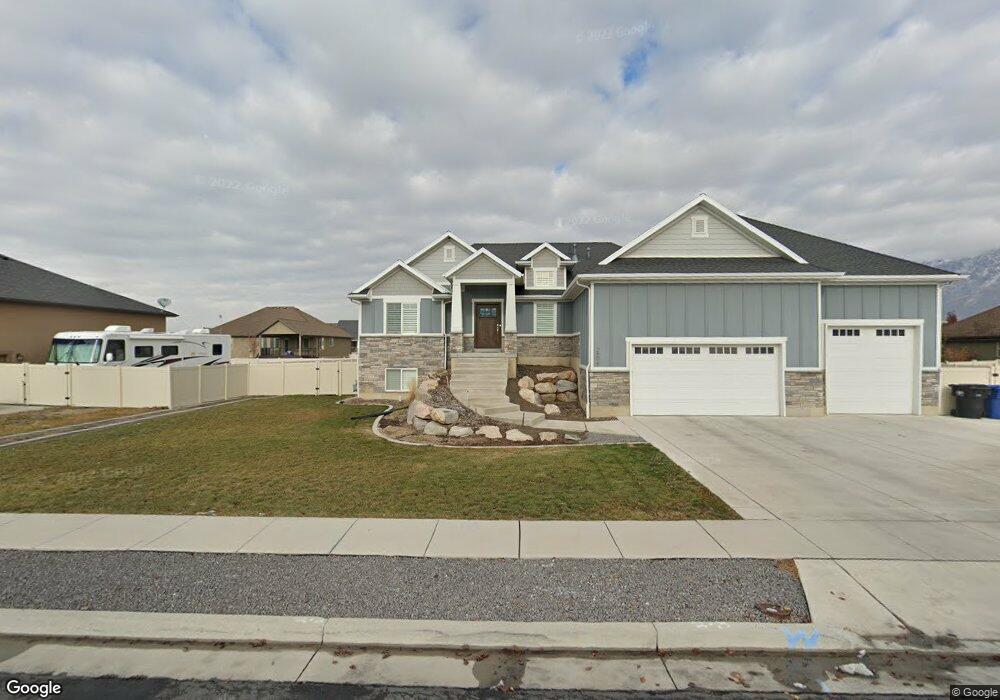
2652 W 2225 N Farr West, UT 84404
Estimated Value: $748,000 - $830,000
6
Beds
4
Baths
3,851
Sq Ft
$206/Sq Ft
Est. Value
About This Home
This home is located at 2652 W 2225 N, Farr West, UT 84404 and is currently estimated at $794,049, approximately $206 per square foot. 2652 W 2225 N is a home located in Weber County with nearby schools including Farr West Elementary School, Wahlquist Junior High School, and Fremont High School.
Ownership History
Date
Name
Owned For
Owner Type
Purchase Details
Closed on
Feb 23, 2021
Sold by
Christensen Nathan R and Christensen Chelsey
Bought by
Dixon Shaun David and Dixon Jessica
Current Estimated Value
Home Financials for this Owner
Home Financials are based on the most recent Mortgage that was taken out on this home.
Original Mortgage
$450,000
Outstanding Balance
$402,476
Interest Rate
2.7%
Mortgage Type
New Conventional
Estimated Equity
$391,573
Purchase Details
Closed on
Aug 20, 2014
Sold by
Gray Stone Development Inc
Bought by
Christensen Nathan R and Christensen Chelsey
Home Financials for this Owner
Home Financials are based on the most recent Mortgage that was taken out on this home.
Original Mortgage
$223,644
Interest Rate
4.12%
Mortgage Type
New Conventional
Purchase Details
Closed on
Feb 24, 2014
Sold by
Mountain View Title & Escrow Inc
Bought by
Geay Stone Development Inc
Create a Home Valuation Report for This Property
The Home Valuation Report is an in-depth analysis detailing your home's value as well as a comparison with similar homes in the area
Home Values in the Area
Average Home Value in this Area
Purchase History
| Date | Buyer | Sale Price | Title Company |
|---|---|---|---|
| Dixon Shaun David | -- | Mountain View Title Ogden | |
| Christensen Nathan R | -- | Inwest Title | |
| Geay Stone Development Inc | -- | Mountain View Title Ogden |
Source: Public Records
Mortgage History
| Date | Status | Borrower | Loan Amount |
|---|---|---|---|
| Open | Dixon Shaun David | $450,000 | |
| Previous Owner | Christensen Nathan R | $223,644 |
Source: Public Records
Tax History Compared to Growth
Tax History
| Year | Tax Paid | Tax Assessment Tax Assessment Total Assessment is a certain percentage of the fair market value that is determined by local assessors to be the total taxable value of land and additions on the property. | Land | Improvement |
|---|---|---|---|---|
| 2025 | $4,258 | $742,943 | $200,000 | $542,943 |
| 2024 | $4,224 | $412,499 | $109,858 | $302,641 |
| 2023 | $3,997 | $386,100 | $109,655 | $276,445 |
| 2022 | $4,272 | $421,850 | $98,890 | $322,960 |
| 2021 | $3,288 | $548,000 | $104,859 | $443,141 |
| 2020 | $3,032 | $463,000 | $84,870 | $378,130 |
| 2019 | $2,973 | $429,000 | $84,931 | $344,069 |
| 2018 | $2,990 | $413,000 | $84,931 | $328,069 |
| 2017 | $2,731 | $366,000 | $77,925 | $288,075 |
| 2016 | $2,541 | $183,965 | $35,961 | $148,004 |
| 2015 | $2,336 | $166,554 | $35,961 | $130,593 |
| 2014 | $865 | $60,139 | $60,139 | $0 |
Source: Public Records
Map
Nearby Homes
- 2172 N 2625 W
- 2673 W 2125 N
- 2124 Heritage Dr
- 2068 N 2850 W
- 2307 N 2850 W
- 2176 N 2900 W
- 3047 N 2875 W Unit 7
- 2705 2825 W Unit 67
- 2950 W 1975 N
- 2801 W 1900 N
- 2495 N 2850 W
- 2540 W 2575 N
- 2443 W 2950 N Unit 99
- 2443 W 2950 N
- 2730 N 2775 W Unit 113
- 2081 W 1575 N Unit 127
- 2788 W 2775 N Unit 104
- 4195 W 1575 N Unit 204
- 4183 W 1575 N Unit 205
- 2405 W 2825 N
- 2655 W 2275 N
- 2641 W 2275 N
- 2669 W 2275 N Unit 40
- 2655 W 2225 N
- 2641 W 2225 N Unit 12
- 2669 W 2225 N
- 2624 W 2225 N
- 2680 W 2225 N
- 2683 W 2275 N
- 2683 W 2225 N
- 2627 W 2225 N Unit R11
- 2668 W 2275 N
- 2638 W 2275 N
- 2608 W 2225 N
- 2694 W 2225 N
- 1593 2275 N
- 2632 W 2175 N
- 2648 W 2175 N Unit 4
- 2613 W 2275 N
- 2252 N 2700 W