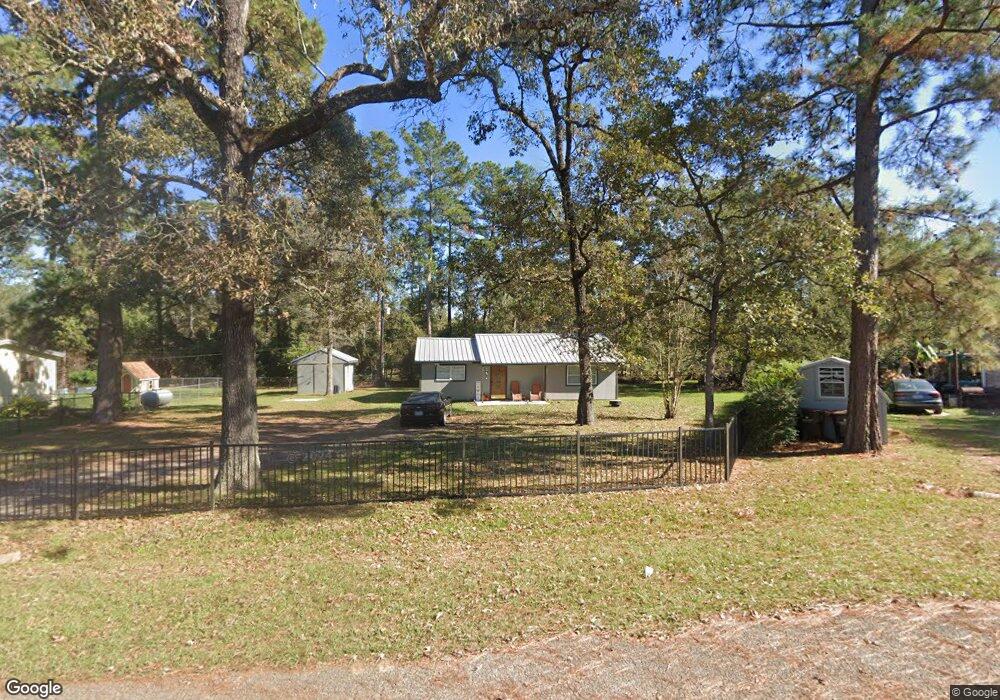
26522 S Dogwood Ln Magnolia, TX 77355
Estimated Value: $171,361 - $301,000
2
Beds
1
Bath
568
Sq Ft
$392/Sq Ft
Est. Value
About This Home
This home is located at 26522 S Dogwood Ln, Magnolia, TX 77355 and is currently estimated at $222,840, approximately $392 per square foot. 26522 S Dogwood Ln is a home located in Montgomery County with nearby schools including Nichols Sawmill Elementary School, Magnolia Sixth Grade Campus, and Magnolia Junior High School.
Ownership History
Date
Name
Owned For
Owner Type
Purchase Details
Closed on
Oct 16, 2009
Sold by
Theroux Brian Louis and Theroux Merita M
Bought by
Bright Sandra
Current Estimated Value
Home Financials for this Owner
Home Financials are based on the most recent Mortgage that was taken out on this home.
Original Mortgage
$58,284
Outstanding Balance
$38,175
Interest Rate
5.14%
Mortgage Type
FHA
Estimated Equity
$184,665
Purchase Details
Closed on
Jan 30, 1998
Sold by
Gonzalez David Anthony and Gonzalez Christine
Bought by
Theroux Brian Louis
Home Financials for this Owner
Home Financials are based on the most recent Mortgage that was taken out on this home.
Original Mortgage
$46,920
Interest Rate
6.98%
Mortgage Type
VA
Purchase Details
Closed on
Mar 21, 1995
Sold by
Sunbelt National Mtg Corp
Bought by
Va
Purchase Details
Closed on
Mar 7, 1995
Sold by
Lowery Randell O and Lowery Vivian A
Bought by
Sunbelt National Mtg Corp
Purchase Details
Closed on
Dec 1, 1985
Bought by
Bright Sandra
Create a Home Valuation Report for This Property
The Home Valuation Report is an in-depth analysis detailing your home's value as well as a comparison with similar homes in the area
Home Values in the Area
Average Home Value in this Area
Purchase History
| Date | Buyer | Sale Price | Title Company |
|---|---|---|---|
| Bright Sandra | -- | Chicago Title | |
| Theroux Brian Louis | -- | Regency Title Company | |
| Va | -- | -- | |
| Sunbelt National Mtg Corp | $27,954 | -- | |
| Bright Sandra | -- | -- |
Source: Public Records
Mortgage History
| Date | Status | Borrower | Loan Amount |
|---|---|---|---|
| Open | Bright Sandra | $58,284 | |
| Previous Owner | Theroux Brian Louis | $46,920 |
Source: Public Records
Tax History Compared to Growth
Tax History
| Year | Tax Paid | Tax Assessment Tax Assessment Total Assessment is a certain percentage of the fair market value that is determined by local assessors to be the total taxable value of land and additions on the property. | Land | Improvement |
|---|---|---|---|---|
| 2025 | $573 | $89,887 | $37,462 | $52,425 |
| 2024 | $531 | $102,911 | $37,462 | $65,449 |
| 2023 | $531 | $100,580 | $37,460 | $63,120 |
| 2022 | $2,009 | $67,100 | $74,920 | $38,910 |
| 2021 | $1,134 | $61,000 | $18,920 | $46,410 |
| 2020 | $1,122 | $55,450 | $18,920 | $44,350 |
| 2019 | $1,015 | $50,410 | $18,920 | $39,250 |
| 2018 | $570 | $45,830 | $12,040 | $33,790 |
| 2017 | $1,001 | $47,220 | $12,040 | $40,250 |
| 2016 | $910 | $42,930 | $8,600 | $41,460 |
| 2015 | $547 | $39,030 | $8,600 | $41,460 |
| 2014 | $547 | $35,480 | $8,600 | $26,880 |
Source: Public Records
Map
Nearby Homes
- 26530 S Dogwood Ln
- 26523 S Carrol Ln
- 26603 N Marek Ln
- 00000 Butera Rd
- 21242 Natalia Grove
- 27114 N Heaton Ln
- 16910 Butera Rd
- 16115 Antelope Ln
- 26718 Stagecoach Crossing Dr
- 17447 Country Skies
- 24754 Majestic Cone Ln
- 26115 Country Woods Trail
- 17503 Heaton Ct
- 17910 Sea Turtle Ct
- 27011 Sunset Dr
- 17103 Indigo Hills Dr
- 31915 Walnut Creek Rd
- 19007 Turtle Creek Way
- 19830 Turtle Dove Ln
- 21610 Meadowsweet Dr
- 26518 S Dogwood Ln
- 17406 Spruce Ln
- 26527 S Dogwood Ln
- 17410 Spruce Ln
- 26419 Mcintosh Rd
- 26506 S Dogwood Ln
- 26415 Mcintosh Rd
- 26534 S Dogwood Ln
- 17418 Spruce Ln
- 26502 S Heaton Ln
- 17323 Butera Rd
- 40419 Pine Spruce Ln
- 8202 Red Spruce St
- 40647 Pine Spruce Ln
- 17319 Butera Rd
- 26538 S Dogwood Ln
- 26518 Mcintosh Rd
- 26514 S Heaton Ln
- 26418 Mcintosh Rd
- 17105 Butera Rd