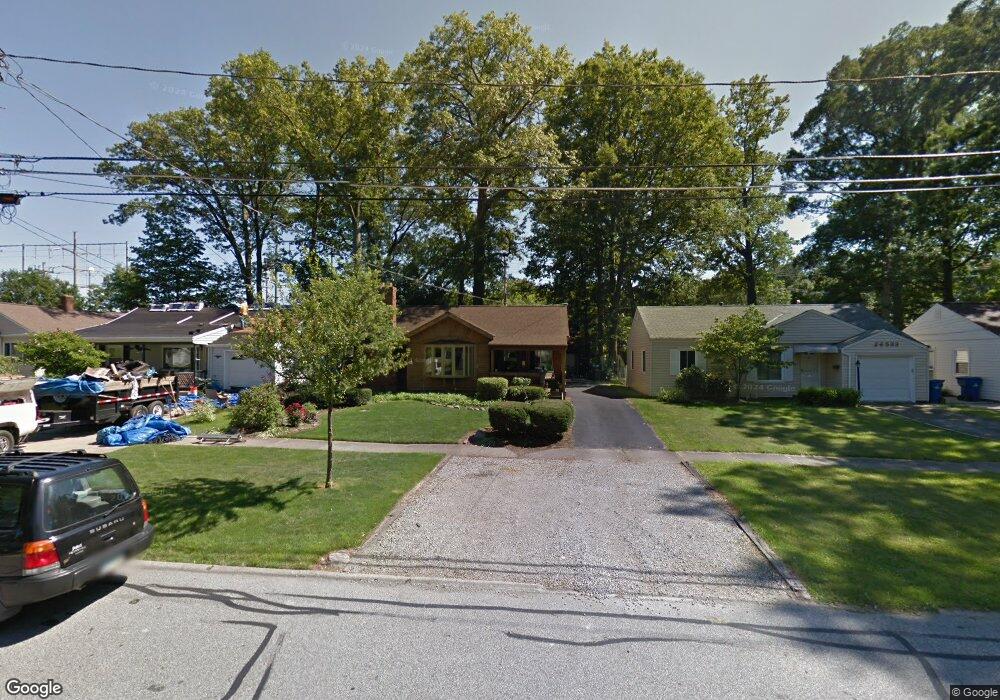
26527 Knickerbocker Rd Bay Village, OH 44140
Estimated Value: $219,000 - $267,000
1
Bed
1
Bath
944
Sq Ft
$249/Sq Ft
Est. Value
About This Home
This home is located at 26527 Knickerbocker Rd, Bay Village, OH 44140 and is currently estimated at $234,960, approximately $248 per square foot. 26527 Knickerbocker Rd is a home located in Cuyahoga County with nearby schools including Normandy Elementary School, Westerly Elementary School, and Bay Middle School.
Ownership History
Date
Name
Owned For
Owner Type
Purchase Details
Closed on
May 15, 1991
Sold by
Hollan John V
Bought by
Bickford John W
Current Estimated Value
Purchase Details
Closed on
Aug 27, 1990
Sold by
Suster Ronald J
Bought by
Hollan John
Purchase Details
Closed on
Feb 18, 1986
Sold by
Brown James Max
Bought by
Suster Ronald J
Purchase Details
Closed on
Jan 15, 1985
Sold by
Carpenter Wayne R
Bought by
Brown James Max
Purchase Details
Closed on
Mar 26, 1981
Sold by
Bloor Alan R
Bought by
Carpenter Wayne R
Purchase Details
Closed on
Aug 11, 1980
Sold by
Wilber Cynthia Ann
Bought by
Bloor Alan R
Purchase Details
Closed on
Feb 28, 1980
Sold by
Wilber David M
Bought by
Wilber Cynthia Ann
Purchase Details
Closed on
Sep 28, 1978
Sold by
Duffy Timothy J and J C
Bought by
Wilber David M
Purchase Details
Closed on
Jan 1, 1975
Bought by
Duffy Timothy J and J C
Create a Home Valuation Report for This Property
The Home Valuation Report is an in-depth analysis detailing your home's value as well as a comparison with similar homes in the area
Home Values in the Area
Average Home Value in this Area
Purchase History
| Date | Buyer | Sale Price | Title Company |
|---|---|---|---|
| Bickford John W | $84,000 | -- | |
| Hollan John | $78,000 | -- | |
| Suster Ronald J | -- | -- | |
| Suster Ronald J | $45,000 | -- | |
| Brown James Max | $51,500 | -- | |
| Carpenter Wayne R | $49,300 | -- | |
| Bloor Alan R | $47,000 | -- | |
| Wilber Cynthia Ann | -- | -- | |
| Wilber David M | $42,200 | -- | |
| Duffy Timothy J | -- | -- |
Source: Public Records
Tax History Compared to Growth
Tax History
| Year | Tax Paid | Tax Assessment Tax Assessment Total Assessment is a certain percentage of the fair market value that is determined by local assessors to be the total taxable value of land and additions on the property. | Land | Improvement |
|---|---|---|---|---|
| 2024 | $3,431 | $64,750 | $17,500 | $47,250 |
| 2023 | $1,811 | $40,950 | $16,450 | $24,500 |
| 2022 | $1,867 | $40,950 | $16,450 | $24,500 |
| 2021 | $1,692 | $40,950 | $16,450 | $24,500 |
| 2020 | $1,404 | $35,000 | $14,070 | $20,930 |
| 2019 | $1,363 | $100,000 | $40,200 | $59,800 |
| 2018 | $2,395 | $45,150 | $14,070 | $31,080 |
| 2017 | $2,840 | $41,940 | $11,310 | $30,630 |
| 2016 | $2,828 | $41,940 | $11,310 | $30,630 |
| 2015 | $2,488 | $41,940 | $11,310 | $30,630 |
| 2014 | $2,488 | $38,820 | $10,470 | $28,350 |
Source: Public Records
Map
Nearby Homes
- 26927 E Oviatt Rd
- 468 Canterbury Rd
- 26819 Normandy Rd
- 27029 Normandy Rd
- 27028 Normandy Rd
- 349 Kenilworth Rd
- 27320 Langale Rd
- 495 Cahoon Rd
- 27407 Wolf Rd
- 481 Cahoon Rd
- 479 Cahoon Rd
- 477 Cahoon Rd
- 575 Columbia Rd
- 1326 Marview Dr
- 401 Columbia Rd
- 25550 Lake Rd
- 25111 Bayfair Ct
- 1432 Stone Ct
- 28205 W Oviatt Rd
- 1455 Mozart Dr
- 26533 Knickerbocker Rd
- 26523 Knickerbocker Rd
- 26537 Knickerbocker Rd
- 26517 Knickerbocker Rd
- 26513 Knickerbocker Rd
- 26603 Knickerbocker Rd
- 26509 Knickerbocker Rd
- 26611 Knickerbocker Rd
- 26518 Knickerbocker Rd
- 26505 Knickerbocker Rd
- 26615 Knickerbocker Rd
- 26526 Knickerbocker Rd
- 26522 Knickerbocker Rd
- 26534 Knickerbocker Rd
- 26512 Knickerbocker Rd
- 26600 Knickerbocker Rd
- 26501 Knickerbocker Rd
- 26608 Knickerbocker Rd
- 26619 Knickerbocker Rd
- 606 Glen Park Dr