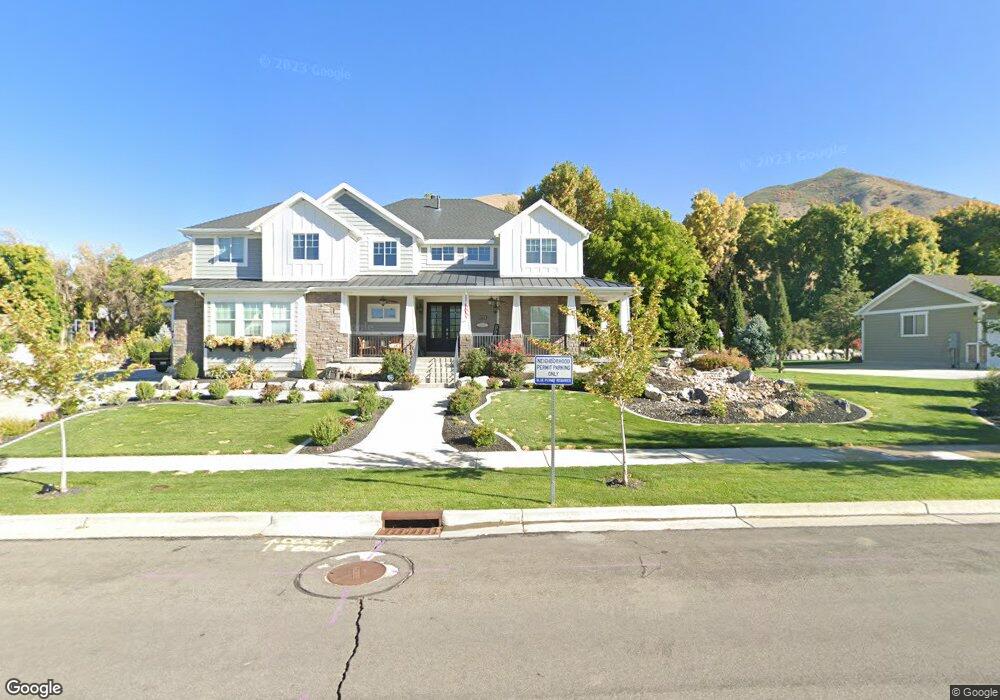
2653 E 1100 S Unit 7 Springville, UT 84663
East Hobble Creek NeighborhoodEstimated Value: $919,000 - $1,246,648
5
Beds
4
Baths
3,185
Sq Ft
$330/Sq Ft
Est. Value
About This Home
This home is located at 2653 E 1100 S Unit 7, Springville, UT 84663 and is currently estimated at $1,051,216, approximately $330 per square foot. 2653 E 1100 S Unit 7 is a home located in Utah County with nearby schools including Hobble Creek School, Springville High School, and Springville Junior High School.
Ownership History
Date
Name
Owned For
Owner Type
Purchase Details
Closed on
Apr 11, 2016
Sold by
White Tyler J and White Almee
Bought by
White A Tyler J
Current Estimated Value
Home Financials for this Owner
Home Financials are based on the most recent Mortgage that was taken out on this home.
Original Mortgage
$484,500
Outstanding Balance
$388,905
Interest Rate
3.68%
Mortgage Type
Construction
Estimated Equity
$662,311
Purchase Details
Closed on
Feb 15, 2012
Sold by
Hullinger D Scott and Hullinger Kirsten
Bought by
White Tyler J and White Aimee
Home Financials for this Owner
Home Financials are based on the most recent Mortgage that was taken out on this home.
Original Mortgage
$93,600
Interest Rate
3.86%
Mortgage Type
Balloon
Purchase Details
Closed on
Apr 21, 2010
Sold by
The Rivers Llc
Bought by
Hullinger D Scott and Hullinger Kirsten
Create a Home Valuation Report for This Property
The Home Valuation Report is an in-depth analysis detailing your home's value as well as a comparison with similar homes in the area
Home Values in the Area
Average Home Value in this Area
Purchase History
| Date | Buyer | Sale Price | Title Company |
|---|---|---|---|
| White A Tyler J | -- | North American Title Orem | |
| White Tyler J | -- | Pro Title & Escrow Inc | |
| Hullinger D Scott | -- | Metro National Title |
Source: Public Records
Mortgage History
| Date | Status | Borrower | Loan Amount |
|---|---|---|---|
| Open | White A Tyler J | $484,500 | |
| Closed | White Tyler J | $93,600 |
Source: Public Records
Tax History
| Year | Tax Paid | Tax Assessment Tax Assessment Total Assessment is a certain percentage of the fair market value that is determined by local assessors to be the total taxable value of land and additions on the property. | Land | Improvement |
|---|---|---|---|---|
| 2025 | $4,787 | $575,190 | -- | -- |
| 2024 | $4,787 | $490,435 | $0 | $0 |
| 2023 | $4,659 | $477,785 | $0 | $0 |
| 2022 | $4,357 | $438,845 | $0 | $0 |
| 2021 | $3,829 | $600,200 | $176,200 | $424,000 |
| 2020 | $3,645 | $554,000 | $153,200 | $400,800 |
| 2019 | $3,573 | $552,900 | $153,200 | $399,700 |
| 2018 | $3,953 | $583,500 | $190,400 | $393,100 |
| 2017 | $3,743 | $293,480 | $0 | $0 |
| 2016 | $1,832 | $140,800 | $0 | $0 |
| 2015 | $1,792 | $140,800 | $0 | $0 |
| 2014 | $1,729 | $135,000 | $0 | $0 |
Source: Public Records
Map
Nearby Homes
- 1052 Cove Dr
- 2881 Thirty Oaks Dr Unit 6
- 2881 Thirty Oaks Dr
- 2541 Stonebury Loop Rd
- 715 E 1700 N
- 829 S 2200 E
- 1447 N 1350 St E Unit 5
- 1577 N 1350 St E Unit 1
- 1477 N 1350 St E Unit 4
- 1547 N 1350 St E Unit 2
- 1511 N 1350 St E Unit 3
- 1548 N 1350 St E Unit 11
- 1578 N 1350 St E Unit 12
- 1564 N 1700 East St
- 24 Quiet Meadow Ln
- 1092 Valley Sage Dr
- 1567 N 600 E Unit 26
- 1096 N 1000 E
- 1884 Town And Country Rd
- 1839 River Bottom Rd
- 2677 E 1100 S Unit 6
- 2677 E 1100 S
- 2611 E 1100 S Unit 8
- 2611 E 1100 S
- 2658 E 1100 S Unit 18
- 2658 E 1100 S
- 2646 E 1100 S Unit 12
- 2646 E 1100 S
- 2577 E 1100 S Unit 9
- 2577 E 1100 S
- 2598 E 1100 S Unit 11
- 2598 E 1100 S
- 2709 E 1100 S Unit 5
- 2686 E 1100 S Unit 19
- 2630 Canyon Rd
- 1329 S 2650 E Unit 17
- 1336 S 2650 E Unit 13
- 2714 E 1100 S
- 2727 E 1100 S Unit 4
- 2541 E 1100 S Unit 10
Your Personal Tour Guide
Ask me questions while you tour the home.