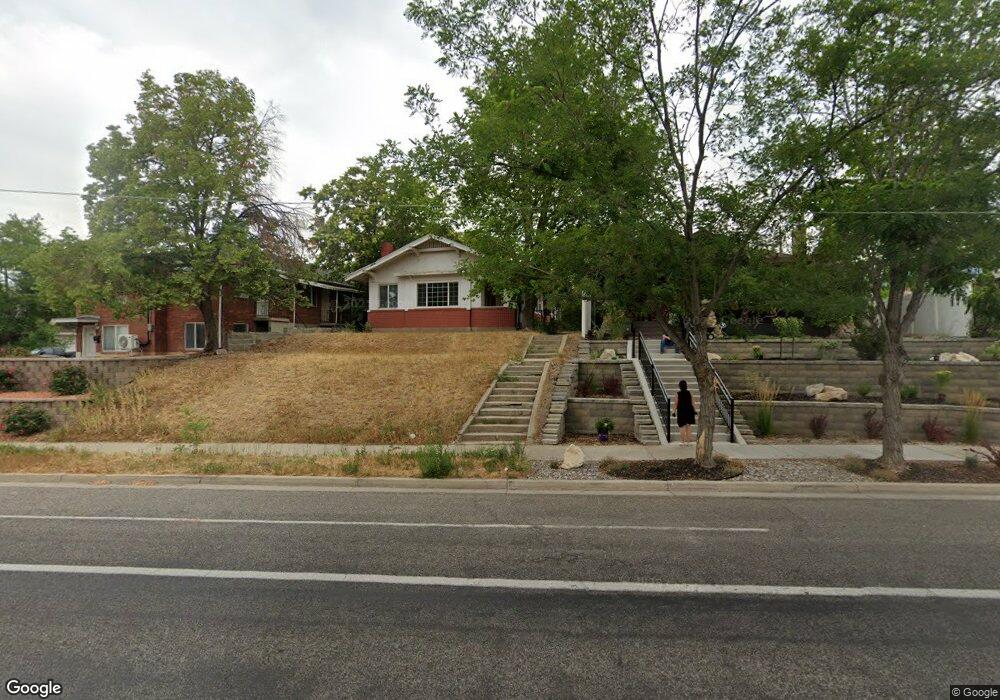
2653 Highland Dr Salt Lake City, UT 84106
Sugar House NeighborhoodEstimated Value: $531,633 - $673,000
3
Beds
1
Bath
1,755
Sq Ft
$335/Sq Ft
Est. Value
About This Home
This home is located at 2653 Highland Dr, Salt Lake City, UT 84106 and is currently estimated at $588,158, approximately $335 per square foot. 2653 Highland Dr is a home located in Salt Lake County with nearby schools including Nibley Park School, Highland High School, and Carden Memorial School.
Ownership History
Date
Name
Owned For
Owner Type
Purchase Details
Closed on
Jan 19, 2017
Sold by
Jensen Kelly and Boettcher Scott H
Bought by
Wright Merrick C and Wright Anthony P
Current Estimated Value
Purchase Details
Closed on
Jun 14, 2007
Sold by
Utah Foreclosure Opportunities Llc
Bought by
Homes Investor Inc
Purchase Details
Closed on
Jun 12, 2007
Sold by
Longacre Steven and Longacre Robert M
Bought by
Utah Foreclosure Opportunities Llc
Purchase Details
Closed on
Oct 3, 2005
Sold by
Pacheco Shellie
Bought by
Longacre Steven and Longacre Robert M
Home Financials for this Owner
Home Financials are based on the most recent Mortgage that was taken out on this home.
Original Mortgage
$231,987
Interest Rate
5.67%
Mortgage Type
FHA
Purchase Details
Closed on
Aug 12, 2003
Sold by
Ferguson Roger and Ferguson Susan L
Bought by
Pacheco Shellie and Longacre Steven
Home Financials for this Owner
Home Financials are based on the most recent Mortgage that was taken out on this home.
Original Mortgage
$152,742
Interest Rate
5.29%
Mortgage Type
FHA
Create a Home Valuation Report for This Property
The Home Valuation Report is an in-depth analysis detailing your home's value as well as a comparison with similar homes in the area
Home Values in the Area
Average Home Value in this Area
Purchase History
| Date | Buyer | Sale Price | Title Company |
|---|---|---|---|
| Wright Merrick C | -- | First American Title | |
| Homes Investor Inc | -- | None Available | |
| Utah Foreclosure Opportunities Llc | $175,400 | Excel Title Ins Agency Llc | |
| Longacre Steven | -- | Patriot Title Llc | |
| Pacheco Shellie | -- | Equity Title |
Source: Public Records
Mortgage History
| Date | Status | Borrower | Loan Amount |
|---|---|---|---|
| Previous Owner | Longacre Steven | $231,987 | |
| Previous Owner | Pacheco Shellie | $152,742 | |
| Closed | Pacheco Shellie | $6,109 |
Source: Public Records
Tax History Compared to Growth
Tax History
| Year | Tax Paid | Tax Assessment Tax Assessment Total Assessment is a certain percentage of the fair market value that is determined by local assessors to be the total taxable value of land and additions on the property. | Land | Improvement |
|---|---|---|---|---|
| 2025 | $2,094 | $462,200 | $147,400 | $314,800 |
| 2024 | $2,094 | $399,500 | $139,600 | $259,900 |
| 2023 | $2,401 | $368,200 | $145,100 | $223,100 |
| 2022 | $2,192 | $378,200 | $142,300 | $235,900 |
| 2021 | $2,066 | $322,800 | $108,700 | $214,100 |
| 2020 | $2,031 | $302,000 | $97,100 | $204,900 |
| 2019 | $2,057 | $287,800 | $89,600 | $198,200 |
| 2018 | $1,821 | $249,000 | $94,600 | $154,400 |
| 2017 | $1,896 | $242,000 | $94,600 | $147,400 |
| 2016 | $1,826 | $221,300 | $79,500 | $141,800 |
| 2015 | $1,827 | $209,900 | $77,900 | $132,000 |
| 2014 | $2,153 | $201,200 | $76,300 | $124,900 |
Source: Public Records
Map
Nearby Homes
- 2710 S Highland Dr Unit 11
- 1190 E 2700 S Unit A4
- 1190 E 2700 S Unit A1
- 1192 E 2700 S
- 2760 S Highland Dr Unit 21
- 1130 E 2700 S Unit K83
- 2477 S Douglas St
- 2618 S 1100 E
- 1150 E 2700 S Unit 50G
- 1150 E 2700 S Unit G51
- 1152 E 2700 S Unit S148
- 1168 E Parkway Ave
- 2430 S Elizabeth St Unit 5
- 2438 S Elizabeth St Unit 2
- 2400 S Elizabeth St Unit 4
- 2865 S 1335 E
- 1314 E Crandall Ave
- 1371 E Zenith Ave
- 2970 S Richmond St
- 916 E Forest View Ave
- 2655 Highland Dr
- 2655 S Highland Dr
- 1256 E Crystal Ave
- 1262 E Crystal Ave
- 2635 Highland Dr
- 1255 Malvern Ave
- 1255 E Malvern Ave
- 2654 Highland Dr
- 2654 S Highland Dr
- 2660 S Highland Dr
- 1215 Caton Way
- 1249 E Crystal Ave
- 2664 S Highland Dr
- 2623 Highland Dr
- 2623 S Highland Dr
- 1261 Malvern Ave
- 2644 Highland Dr
- 2644 S Highland Dr
- 2648 Highland Dr
- 1270 E Crystal Ave