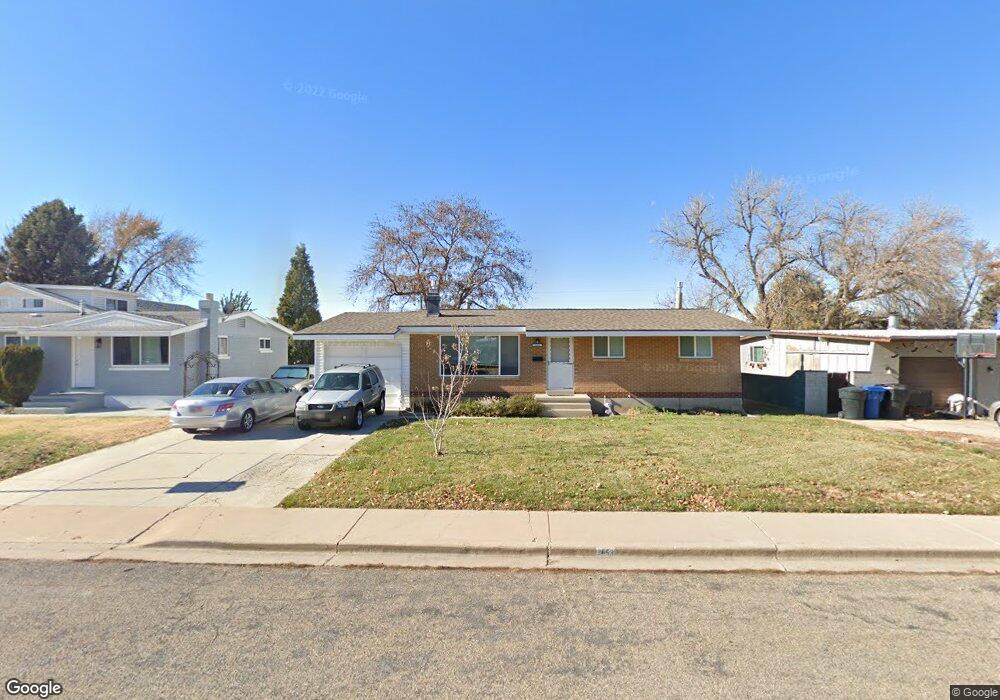
2653 N 225 W Clearfield, UT 84015
Estimated Value: $396,000 - $428,749
4
Beds
3
Baths
2,200
Sq Ft
$188/Sq Ft
Est. Value
About This Home
This home is located at 2653 N 225 W, Clearfield, UT 84015 and is currently estimated at $413,437, approximately $187 per square foot. 2653 N 225 W is a home located in Davis County with nearby schools including Fremont School, Sunset Junior High School, and Northridge High School.
Ownership History
Date
Name
Owned For
Owner Type
Purchase Details
Closed on
May 29, 2014
Sold by
Boyington Thomas L
Bought by
Boyington Thomas L
Current Estimated Value
Purchase Details
Closed on
May 19, 2014
Sold by
Niensir Tong Pung
Bought by
Boyington Thomas L
Purchase Details
Closed on
Jul 28, 2008
Sold by
Boyington Thomas L
Bought by
Boyington Thomas L and Niensir Tong Pung
Create a Home Valuation Report for This Property
The Home Valuation Report is an in-depth analysis detailing your home's value as well as a comparison with similar homes in the area
Home Values in the Area
Average Home Value in this Area
Purchase History
| Date | Buyer | Sale Price | Title Company |
|---|---|---|---|
| Boyington Thomas L | -- | None Available | |
| Boyington Thomas L | -- | None Available | |
| Boyington Thomas L | -- | None Available |
Source: Public Records
Tax History
| Year | Tax Paid | Tax Assessment Tax Assessment Total Assessment is a certain percentage of the fair market value that is determined by local assessors to be the total taxable value of land and additions on the property. | Land | Improvement |
|---|---|---|---|---|
| 2025 | $2,581 | $235,400 | $78,244 | $157,156 |
| 2024 | $2,345 | $213,950 | $74,760 | $139,190 |
| 2023 | $2,182 | $363,000 | $119,026 | $243,974 |
| 2022 | $2,358 | $212,300 | $67,686 | $144,614 |
| 2021 | $2,021 | $286,000 | $74,976 | $211,024 |
| 2020 | $1,775 | $247,000 | $63,648 | $183,352 |
| 2019 | $1,682 | $240,000 | $77,484 | $162,516 |
| 2018 | $1,496 | $209,000 | $61,921 | $147,079 |
| 2016 | $1,253 | $89,980 | $29,294 | $60,686 |
| 2015 | $1,148 | $78,100 | $29,259 | $48,841 |
| 2014 | $902 | $62,720 | $29,259 | $33,461 |
| 2013 | $989 | $65,407 | $23,265 | $42,142 |
Source: Public Records
Map
Nearby Homes
Your Personal Tour Guide
Ask me questions while you tour the home.