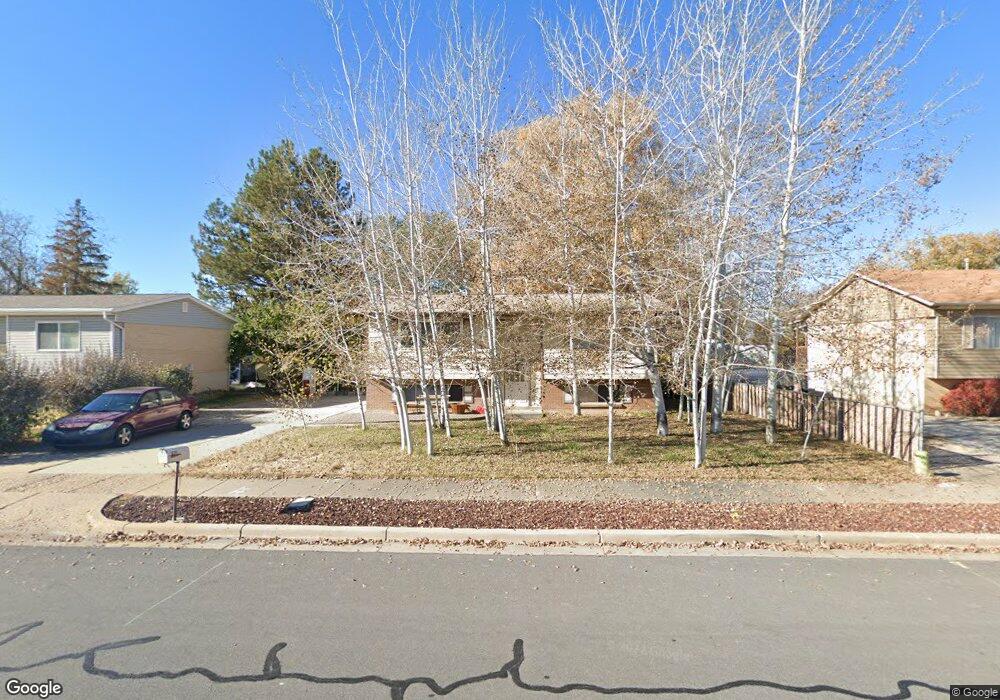
2653 N 770 W Clearfield, UT 84015
Estimated Value: $398,000 - $417,000
4
Beds
2
Baths
1,897
Sq Ft
$215/Sq Ft
Est. Value
About This Home
This home is located at 2653 N 770 W, Clearfield, UT 84015 and is currently estimated at $407,944, approximately $215 per square foot. 2653 N 770 W is a home located in Davis County with nearby schools including Fremont School, Sunset Junior High School, and Northridge High School.
Ownership History
Date
Name
Owned For
Owner Type
Purchase Details
Closed on
Aug 29, 2007
Sold by
Findlay Rosemarie and Smith Rosemarie
Bought by
Sommer Ronald F and Sommer Bobbi
Current Estimated Value
Home Financials for this Owner
Home Financials are based on the most recent Mortgage that was taken out on this home.
Original Mortgage
$8,270
Outstanding Balance
$5,258
Interest Rate
6.74%
Mortgage Type
Stand Alone Second
Estimated Equity
$402,686
Purchase Details
Closed on
Jul 29, 2004
Sold by
Forbes Jeffrey Lynn and Forbes Cindy Sue
Bought by
Smith Rosemarie
Home Financials for this Owner
Home Financials are based on the most recent Mortgage that was taken out on this home.
Original Mortgage
$110,171
Interest Rate
6.29%
Mortgage Type
FHA
Create a Home Valuation Report for This Property
The Home Valuation Report is an in-depth analysis detailing your home's value as well as a comparison with similar homes in the area
Home Values in the Area
Average Home Value in this Area
Purchase History
| Date | Buyer | Sale Price | Title Company |
|---|---|---|---|
| Sommer Ronald F | -- | Inwest Title Services Inc | |
| Smith Rosemarie | -- | First American Title Co |
Source: Public Records
Mortgage History
| Date | Status | Borrower | Loan Amount |
|---|---|---|---|
| Open | Sommer Ronald F | $8,270 | |
| Open | Sommer Ronald F | $137,837 | |
| Previous Owner | Smith Rosemarie | $110,171 | |
| Closed | Smith Rosemarie | $6,610 |
Source: Public Records
Tax History
| Year | Tax Paid | Tax Assessment Tax Assessment Total Assessment is a certain percentage of the fair market value that is determined by local assessors to be the total taxable value of land and additions on the property. | Land | Improvement |
|---|---|---|---|---|
| 2025 | $2,042 | $196,350 | $91,346 | $105,004 |
| 2024 | $2,009 | $194,150 | $100,306 | $93,844 |
| 2023 | $1,851 | $331,000 | $114,302 | $216,698 |
| 2022 | $1,946 | $192,500 | $69,701 | $122,799 |
| 2021 | $1,771 | $260,000 | $87,625 | $172,375 |
| 2020 | $1,528 | $222,000 | $74,651 | $147,349 |
| 2019 | $1,494 | $212,000 | $86,875 | $125,125 |
| 2018 | $1,320 | $184,000 | $73,331 | $110,669 |
| 2016 | $1,131 | $81,400 | $28,596 | $52,804 |
| 2015 | $1,093 | $74,800 | $28,596 | $46,204 |
| 2014 | $1,033 | $71,824 | $28,596 | $43,228 |
| 2013 | -- | $72,934 | $25,230 | $47,704 |
Source: Public Records
Map
Nearby Homes
Your Personal Tour Guide
Ask me questions while you tour the home.