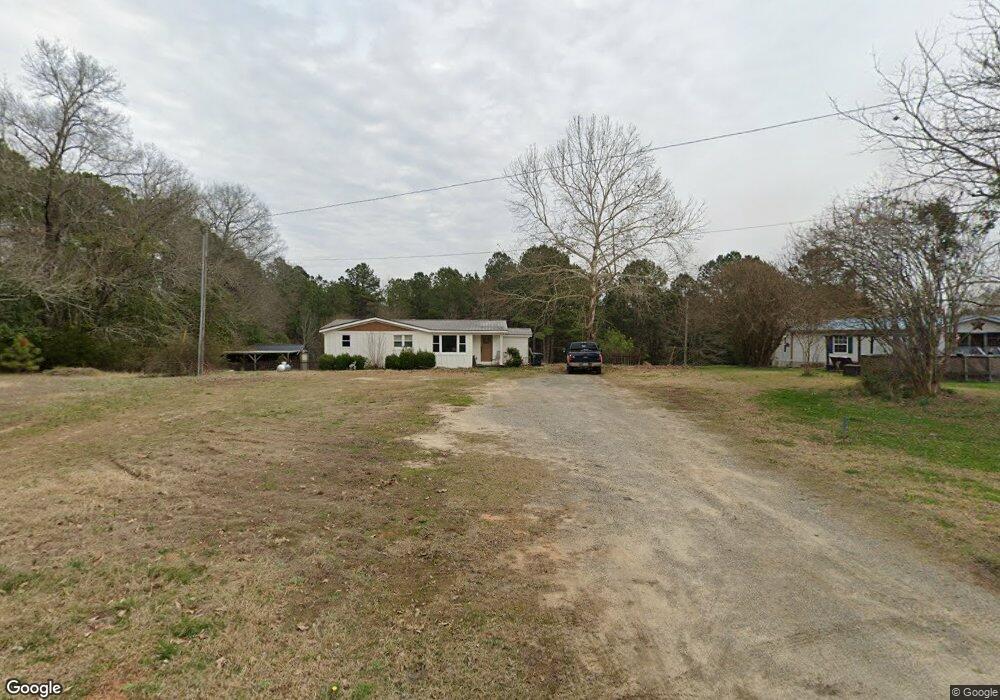
2653 Rachels Dr Appling, GA 30802
Estimated Value: $186,000 - $229,000
3
Beds
2
Baths
1,020
Sq Ft
$201/Sq Ft
Est. Value
About This Home
This home is located at 2653 Rachels Dr, Appling, GA 30802 and is currently estimated at $204,872, approximately $200 per square foot. 2653 Rachels Dr is a home located in Columbia County with nearby schools including North Columbia Elementary School, Harlem Middle School, and Harlem High School.
Ownership History
Date
Name
Owned For
Owner Type
Purchase Details
Closed on
Apr 18, 2022
Sold by
Evans Margaret R
Bought by
Deas Lee A V
Current Estimated Value
Home Financials for this Owner
Home Financials are based on the most recent Mortgage that was taken out on this home.
Original Mortgage
$140,000
Outstanding Balance
$130,938
Interest Rate
3.85%
Mortgage Type
New Conventional
Estimated Equity
$73,934
Purchase Details
Closed on
Mar 6, 2020
Sold by
Evans Margaret Rose
Bought by
Evans Margaret R and Evans Jay D
Home Financials for this Owner
Home Financials are based on the most recent Mortgage that was taken out on this home.
Original Mortgage
$82,500
Interest Rate
3.4%
Mortgage Type
New Conventional
Purchase Details
Closed on
Jul 13, 2015
Sold by
Evans Margaret Rose
Bought by
Hebbard Maggie L and Hebbard Lynn K
Purchase Details
Closed on
Jul 29, 2002
Sold by
Evans Jay D and Evans Margaret R
Bought by
Plagwitz John C
Home Financials for this Owner
Home Financials are based on the most recent Mortgage that was taken out on this home.
Original Mortgage
$72,364
Interest Rate
6.62%
Mortgage Type
FHA
Create a Home Valuation Report for This Property
The Home Valuation Report is an in-depth analysis detailing your home's value as well as a comparison with similar homes in the area
Home Values in the Area
Average Home Value in this Area
Purchase History
| Date | Buyer | Sale Price | Title Company |
|---|---|---|---|
| Deas Lee A V | $175,000 | -- | |
| Evans Margaret R | -- | -- | |
| Hebbard Maggie L | -- | -- | |
| Plagwitz John C | $73,500 | -- |
Source: Public Records
Mortgage History
| Date | Status | Borrower | Loan Amount |
|---|---|---|---|
| Open | Deas Lee A V | $140,000 | |
| Previous Owner | Evans Margaret R | $82,500 | |
| Previous Owner | Plagwitz John C | $72,364 |
Source: Public Records
Tax History Compared to Growth
Tax History
| Year | Tax Paid | Tax Assessment Tax Assessment Total Assessment is a certain percentage of the fair market value that is determined by local assessors to be the total taxable value of land and additions on the property. | Land | Improvement |
|---|---|---|---|---|
| 2025 | $1,776 | $74,495 | $17,146 | $57,349 |
| 2024 | $1,545 | $61,873 | $13,156 | $48,717 |
| 2023 | $1,545 | $42,847 | $8,752 | $34,095 |
| 2022 | $1,060 | $40,818 | $7,651 | $33,167 |
| 2021 | $948 | $34,884 | $7,376 | $27,508 |
| 2020 | $968 | $34,884 | $7,376 | $27,508 |
| 2019 | $1,017 | $36,657 | $7,651 | $29,006 |
| 2018 | $786 | $28,226 | $7,651 | $20,575 |
| 2017 | $803 | $28,742 | $7,651 | $21,091 |
| 2016 | $698 | $25,906 | $6,612 | $19,294 |
| 2015 | -- | $0 | $0 | $0 |
Source: Public Records
Map
Nearby Homes
- 2829 Sellars Rd
- 2839 Sellars Rd
- 2526 Scotts Ferry Rd
- 5570 Tubman Rd
- 1229 Yost Dr
- 3256 Ray Owens Rd
- 307 Alabaster Ct
- 6662 Shucraft Rd
- 3017 Timber Woods Dr
- 3005 Timber Woods Dr
- 3003 Timber Woods Dr
- 3199 Dozier Rd
- 2362 Pine Ridge Dr
- 250 Menros Way
- 255 Menros Way
- 1171 Meandering Trail
- 719 William Ave
- 5726 Tubman Rd
- 7115 Exley Ln
- 411 Josh Christy Cove
- 2667 Panda Ln
- 2657 Rachels Dr
- 2649 Rachels Dr
- 0 Rachels Dr
- 2642 Rachels Dr
- 205 Katie Ln
- 2600 Rachels Dr
- 2643 Rachels Dr
- 2636 Rachels Dr
- 2641 Rachels Dr
- 2709 Scotts Ferry Rd
- 2627 Rachels Dr
- 2639 Panda Ln
- 2667 Rachels Dr
- 2626 Rachels Dr
- 6294 Knox Dr
- 2708 Scotts Ferry Rd
- 6260 Knox Dr
- 6355 Knox Dr
- 2734 Scotts Ferry Rd