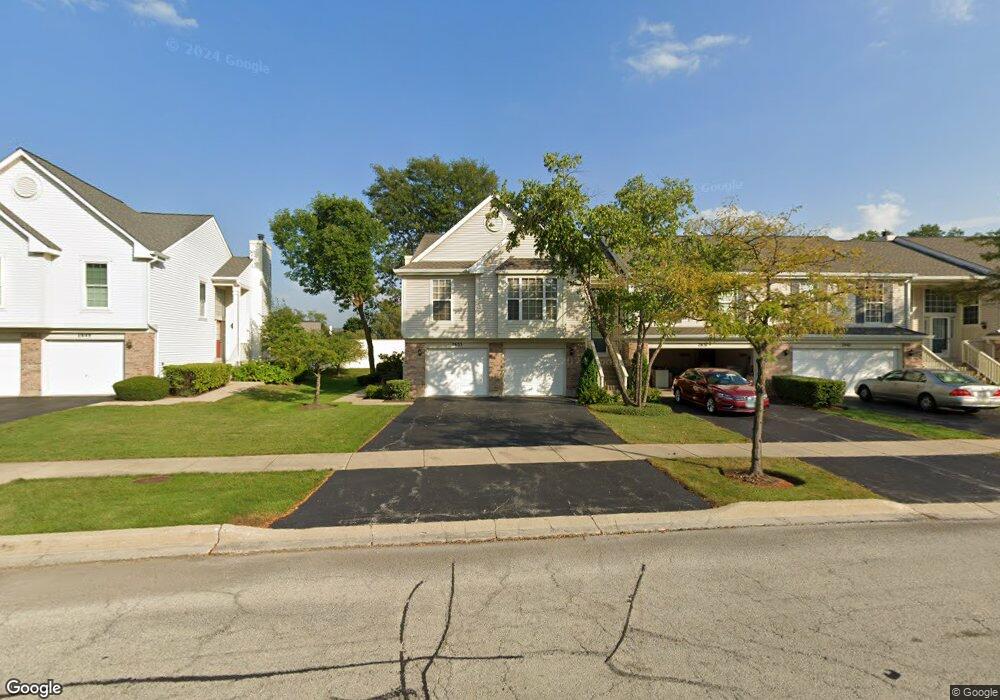
2653 S Embers Ln Unit 142653 Arlington Heights, IL 60005
Estimated Value: $366,614 - $427,000
3
Beds
--
Bath
--
Sq Ft
22.15
Acres
About This Home
This home is located at 2653 S Embers Ln Unit 142653, Arlington Heights, IL 60005 and is currently estimated at $391,404. 2653 S Embers Ln Unit 142653 is a home located in Cook County with nearby schools including Holmes Jr High School, Juliette Low Elementary School, and Rolling Meadows High School.
Ownership History
Date
Name
Owned For
Owner Type
Purchase Details
Closed on
May 30, 2002
Sold by
Gill Pardeep S and Gill Navreena
Bought by
Kowalski Thomas
Current Estimated Value
Home Financials for this Owner
Home Financials are based on the most recent Mortgage that was taken out on this home.
Original Mortgage
$200,000
Outstanding Balance
$84,923
Interest Rate
6.87%
Mortgage Type
Purchase Money Mortgage
Estimated Equity
$306,481
Purchase Details
Closed on
Jul 30, 1998
Sold by
Yoon Jae Y and Yoon Kum Ok
Bought by
Gill Pardeep S and Gill Navreena
Home Financials for this Owner
Home Financials are based on the most recent Mortgage that was taken out on this home.
Original Mortgage
$167,500
Interest Rate
6.75%
Purchase Details
Closed on
Apr 15, 1996
Sold by
Garibaldi Chris P and Garibaldi Heather L
Bought by
Yoon Jae Y and Yoon Kum Ok
Home Financials for this Owner
Home Financials are based on the most recent Mortgage that was taken out on this home.
Original Mortgage
$150,400
Interest Rate
7.91%
Create a Home Valuation Report for This Property
The Home Valuation Report is an in-depth analysis detailing your home's value as well as a comparison with similar homes in the area
Home Values in the Area
Average Home Value in this Area
Purchase History
| Date | Buyer | Sale Price | Title Company |
|---|---|---|---|
| Kowalski Thomas | $217,000 | -- | |
| Gill Pardeep S | $186,500 | Chicago Title Insurance Co | |
| Yoon Jae Y | $188,000 | -- |
Source: Public Records
Mortgage History
| Date | Status | Borrower | Loan Amount |
|---|---|---|---|
| Open | Kowalski Thomas | $200,000 | |
| Previous Owner | Gill Pardeep S | $167,500 | |
| Previous Owner | Yoon Jae Y | $150,400 |
Source: Public Records
Tax History Compared to Growth
Tax History
| Year | Tax Paid | Tax Assessment Tax Assessment Total Assessment is a certain percentage of the fair market value that is determined by local assessors to be the total taxable value of land and additions on the property. | Land | Improvement |
|---|---|---|---|---|
| 2024 | $5,929 | $28,890 | $5,184 | $23,706 |
| 2023 | $6,286 | $28,890 | $5,184 | $23,706 |
| 2022 | $6,286 | $28,890 | $5,184 | $23,706 |
| 2021 | $2,724 | $12,968 | $3,401 | $9,567 |
| 2020 | $2,708 | $12,968 | $3,401 | $9,567 |
| 2019 | $2,762 | $14,536 | $3,401 | $11,135 |
| 2018 | $4,424 | $19,254 | $2,915 | $16,339 |
| 2017 | $4,377 | $19,254 | $2,915 | $16,339 |
| 2016 | $4,322 | $19,254 | $2,915 | $16,339 |
| 2015 | $3,942 | $16,836 | $2,591 | $14,245 |
| 2014 | $3,906 | $16,836 | $2,591 | $14,245 |
| 2013 | $3,796 | $16,836 | $2,591 | $14,245 |
Source: Public Records
Map
Nearby Homes
- 2669 S Embers Ln Unit 142669
- 1107 E Algonquin Rd Unit 4
- 1111 E Algonquin Rd Unit 1
- 1119 E Algonquin Rd Unit 2
- 1119 E Algonquin Rd Unit 7
- 1115 E Algonquin Rd Unit 8
- 2342 S Shag Bark Trail
- 2315 S Goebbert Rd Unit D209
- 2831 S Embers Ln Unit 352831
- 1813 W Pheasant Trail
- 2829 S Briarwood Dr E
- 1822 W Catalpa Ln
- 1785 W Algonquin Rd Unit 2A
- 1727 W Crystal Ln Unit 208
- 1500 S Busse Rd Unit 2D
- 1900 W Knightsbridge Dr Unit 2B
- 1910 W Hatherleigh Ct Unit 2A
- 1915 Whitechapel Dr Unit 1E
- 1747 W Crystal Ln Unit 308
- 2206 S Goebbert Rd Unit 409
- 2657 S Embers Ln Unit A
- 2657 S Embers Ln Unit 142657
- 2671 S Embers Ln
- 2649 S Embers Ln Unit 132649
- 2649 S Embers Ln Unit B
- 2665 S Embers Ln
- 2645 S Embers Ln Unit 132645
- 2645 S Embers Ln Unit 1
- 2641 S Embers Ln Unit 132641
- 2637 S Embers Ln Unit 132637
- 2668 S Embers Ln Unit 2688-B
- 2654 S Embers Ln Unit 82654A
- 2654 S Embers Ln Unit A
- 2660 S Embers Ln Unit 172729
- 2660 S Embers Ln Unit 142665
- 2660 S Embers Ln Unit 32736A
- 2660 S Embers Ln Unit 92634A
- 2660 S Embers Ln Unit 142661
- 2660 S Embers Ln Unit 172713
- 2660 S Embers Ln Unit 82660