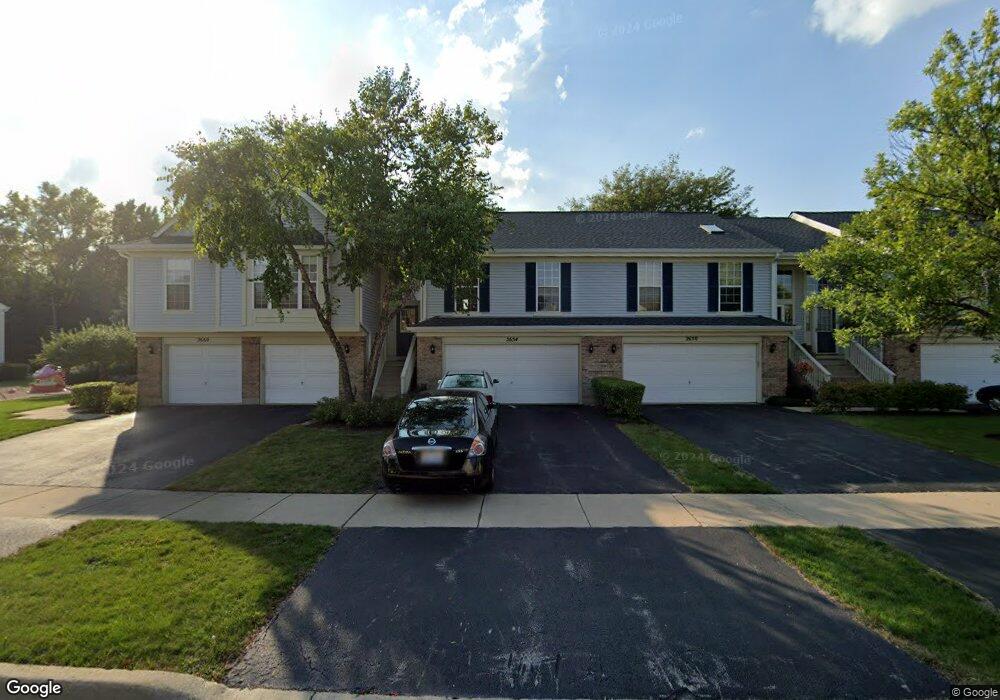
2654 S Embers Ln Unit 82654A Arlington Heights, IL 60005
Estimated Value: $371,000 - $391,000
3
Beds
--
Bath
1,650
Sq Ft
$232/Sq Ft
Est. Value
About This Home
This home is located at 2654 S Embers Ln Unit 82654A, Arlington Heights, IL 60005 and is currently estimated at $383,084, approximately $232 per square foot. 2654 S Embers Ln Unit 82654A is a home located in Cook County with nearby schools including Holmes Jr High School, Juliette Low Elementary School, and Rolling Meadows High School.
Ownership History
Date
Name
Owned For
Owner Type
Purchase Details
Closed on
Nov 14, 2016
Sold by
Emlano Teodoro
Bought by
Husanov Jahongir Y and Husanov Gustiani
Current Estimated Value
Home Financials for this Owner
Home Financials are based on the most recent Mortgage that was taken out on this home.
Original Mortgage
$177,600
Outstanding Balance
$144,047
Interest Rate
3.75%
Mortgage Type
New Conventional
Estimated Equity
$239,037
Purchase Details
Closed on
Aug 13, 2016
Sold by
Emlano Teodoro and Emlano Wilfredo
Bought by
Emlano Teodoro
Purchase Details
Closed on
Oct 3, 2009
Sold by
Emlano Teodoro
Bought by
Emlano Wilfredo and Emlano Rene
Purchase Details
Closed on
Feb 23, 1999
Sold by
Emlano Teodoro E and Emlano Rhoda E
Bought by
Emlano Rhoda E
Home Financials for this Owner
Home Financials are based on the most recent Mortgage that was taken out on this home.
Original Mortgage
$87,000
Interest Rate
6.83%
Create a Home Valuation Report for This Property
The Home Valuation Report is an in-depth analysis detailing your home's value as well as a comparison with similar homes in the area
Home Values in the Area
Average Home Value in this Area
Purchase History
| Date | Buyer | Sale Price | Title Company |
|---|---|---|---|
| Husanov Jahongir Y | $222,000 | Greater Illinois Title | |
| Emlano Teodoro | -- | Attorney | |
| Emlano Wilfredo | -- | None Available | |
| Emlano Rhoda E | -- | -- |
Source: Public Records
Mortgage History
| Date | Status | Borrower | Loan Amount |
|---|---|---|---|
| Open | Husanov Jahongir Y | $177,600 | |
| Previous Owner | Emlano Rhoda E | $87,000 |
Source: Public Records
Tax History Compared to Growth
Tax History
| Year | Tax Paid | Tax Assessment Tax Assessment Total Assessment is a certain percentage of the fair market value that is determined by local assessors to be the total taxable value of land and additions on the property. | Land | Improvement |
|---|---|---|---|---|
| 2024 | $6,126 | $27,001 | $4,845 | $22,156 |
| 2023 | $5,820 | $27,001 | $4,845 | $22,156 |
| 2022 | $5,820 | $27,001 | $4,845 | $22,156 |
| 2021 | $2,484 | $12,121 | $3,179 | $8,942 |
| 2020 | $2,476 | $12,121 | $3,179 | $8,942 |
| 2019 | $3,379 | $13,586 | $3,179 | $10,407 |
| 2018 | $5,033 | $17,996 | $2,725 | $15,271 |
| 2017 | $4,961 | $17,996 | $2,725 | $15,271 |
| 2016 | $3,997 | $17,996 | $2,725 | $15,271 |
| 2015 | $3,637 | $15,735 | $2,422 | $13,313 |
| 2014 | $3,605 | $15,735 | $2,422 | $13,313 |
| 2013 | $3,501 | $15,735 | $2,422 | $13,313 |
Source: Public Records
Map
Nearby Homes
- 2669 S Embers Ln Unit 142669
- 1107 E Algonquin Rd Unit 4
- 1111 E Algonquin Rd Unit 1
- 1119 E Algonquin Rd Unit 2
- 1119 E Algonquin Rd Unit 7
- 1115 E Algonquin Rd Unit 8
- 2342 S Shag Bark Trail
- 2315 S Goebbert Rd Unit D209
- 2831 S Embers Ln Unit 352831
- 1813 W Pheasant Trail
- 2829 S Briarwood Dr E
- 1822 W Catalpa Ln
- 1785 W Algonquin Rd Unit 2A
- 1727 W Crystal Ln Unit 208
- 1500 S Busse Rd Unit 2D
- 1900 W Knightsbridge Dr Unit 2B
- 2206 S Goebbert Rd Unit 409
- 1910 W Hatherleigh Ct Unit 2A
- 1915 Whitechapel Dr Unit 1E
- 1747 W Crystal Ln Unit 308
- 2654 S Embers Ln Unit A
- 2650 S Embers Ln Unit 82650A
- 2650 S Embers Ln Unit A
- 2660 S Embers Ln Unit 172729
- 2660 S Embers Ln Unit 142665
- 2660 S Embers Ln Unit 32736A
- 2660 S Embers Ln Unit 92634A
- 2660 S Embers Ln Unit 142661
- 2660 S Embers Ln Unit 172713
- 2660 S Embers Ln Unit 82660
- 2660 S Embers Ln Unit 32732B
- 2660 S Embers Ln Unit 102602
- 2660 S Embers Ln Unit 102614
- 2668 S Embers Ln Unit 2688-B
- 2646 S Embers Ln Unit 82646A
- 2642 S Embers Ln Unit 82642B
- 2671 S Embers Ln
- 2638 S Embers Ln Unit 92638B
- 2638 S Embers Ln Unit B
- 2664 S Embers Ln Unit 72664B