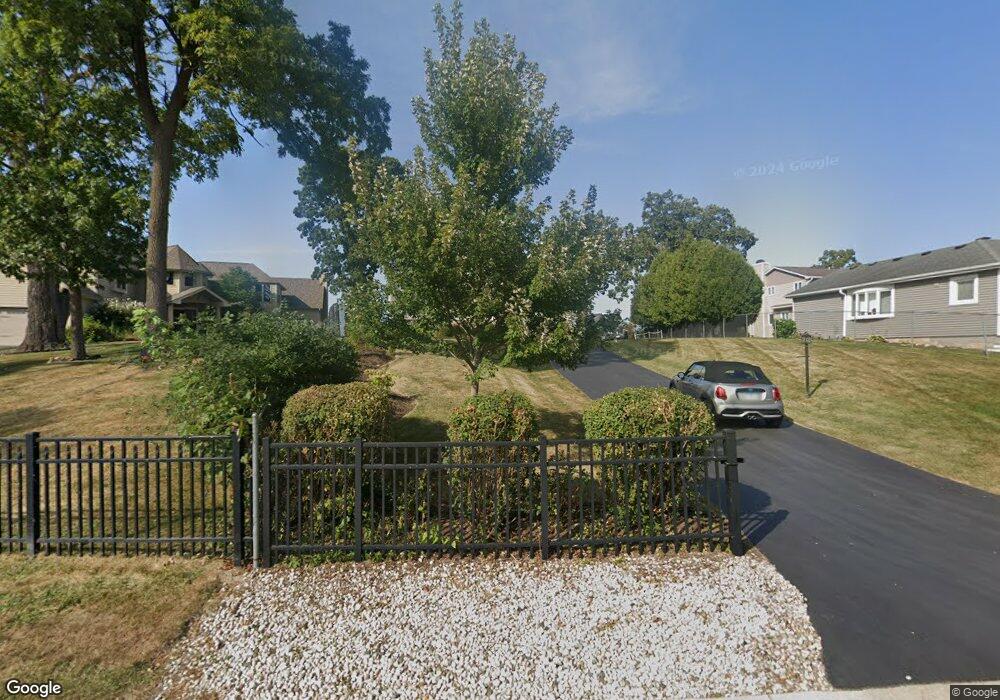
26546 W Ingleside Shore Rd Ingleside, IL 60041
Estimated Value: $529,000 - $1,148,030
4
Beds
1
Bath
2,541
Sq Ft
$375/Sq Ft
Est. Value
About This Home
This home is located at 26546 W Ingleside Shore Rd, Ingleside, IL 60041 and is currently estimated at $952,008, approximately $374 per square foot. 26546 W Ingleside Shore Rd is a home located in Lake County with nearby schools including Gavin Central Elementary School, Gavin South Middle School, and Grant Community High School.
Ownership History
Date
Name
Owned For
Owner Type
Purchase Details
Closed on
Sep 21, 2018
Sold by
Wojcik Norbert R and Wojcik Mary Kathleen
Bought by
Wojcik Mary K and Mary K Wojcik Revocable Trust
Current Estimated Value
Purchase Details
Closed on
Sep 2, 2010
Sold by
Sauer Douglas S
Bought by
Wojcik Norbert R and Wojcik Mary Kathleen
Purchase Details
Closed on
Mar 26, 2004
Sold by
Monk Harry D and Monk Mary K
Bought by
Sauer Douglas S
Home Financials for this Owner
Home Financials are based on the most recent Mortgage that was taken out on this home.
Original Mortgage
$235,000
Interest Rate
5.48%
Mortgage Type
Purchase Money Mortgage
Purchase Details
Closed on
Dec 22, 1999
Sold by
Lasalle Bank National Assn
Bought by
Monk Harry D and Monk Mary K
Create a Home Valuation Report for This Property
The Home Valuation Report is an in-depth analysis detailing your home's value as well as a comparison with similar homes in the area
Home Values in the Area
Average Home Value in this Area
Purchase History
| Date | Buyer | Sale Price | Title Company |
|---|---|---|---|
| Wojcik Mary K | -- | None Available | |
| Wojcik Norbert R | $255,000 | None Available | |
| Sauer Douglas S | $350,000 | First American Title Insuran | |
| Monk Harry D | -- | -- |
Source: Public Records
Mortgage History
| Date | Status | Borrower | Loan Amount |
|---|---|---|---|
| Previous Owner | Sauer Douglas S | $235,000 |
Source: Public Records
Tax History Compared to Growth
Tax History
| Year | Tax Paid | Tax Assessment Tax Assessment Total Assessment is a certain percentage of the fair market value that is determined by local assessors to be the total taxable value of land and additions on the property. | Land | Improvement |
|---|---|---|---|---|
| 2024 | $20,158 | $331,359 | $48,006 | $283,353 |
| 2023 | $20,293 | $267,698 | $45,225 | $222,473 |
| 2022 | $20,293 | $261,525 | $45,654 | $215,871 |
| 2021 | $19,588 | $246,512 | $43,033 | $203,479 |
| 2020 | $17,758 | $219,394 | $42,418 | $176,976 |
| 2019 | $17,169 | $210,389 | $40,677 | $169,712 |
| 2018 | $18,419 | $224,102 | $63,806 | $160,296 |
| 2017 | $18,045 | $207,138 | $58,976 | $148,162 |
| 2016 | $22,642 | $217,845 | $53,938 | $163,907 |
| 2015 | $14,984 | $128,231 | $50,334 | $77,897 |
| 2014 | $4,974 | $59,270 | $59,270 | $0 |
| 2012 | $6,859 | $46,072 | $46,072 | $0 |
Source: Public Records
Map
Nearby Homes
- 42 Rushmore Rd
- 36379 N Wesley Rd
- 43 Lippincott Rd
- 91 Lippincott Rd
- 37322 N Stanton Point Rd
- 69 Washington St
- 50 N Lake Ave
- 314 Mastodon Dr
- 235 E Grand Ave
- 8 S Lake Ave
- 29 S Hickory Ave
- 10 S Maple Ave
- 36497 N Hawthorne Ln
- 38 S Maple Ave
- 605 Rollins Rd
- 37 Hillcrest Ave
- 35835 N Benjamin Ave
- 35729 N Watson Ave
- 35663 N Helendale Rd
- 54 Hillcrest Ave
- 26528 W Ingleside Shore Rd
- 26560 W Ingleside Shore Rd
- 26524 W Ingleside Shore Rd
- 26574 W Ingleside Shore Rd
- 26516 W Ingleside Shore Rd
- 26563 W Ingleside Shore Rd
- 26527 W Ingleside Shore Rd
- 26584 W Ingleside Shore Rd
- 26523 W Ingleside Shore Rd
- 26597 W Ingleside Shore Rd
- 26545 W Ingleside Shore Rd
- 26490 W Ingleside Shore Rd
- 26577 W Ingleside Shore Rd
- 26600 W Ingleside Shore Rd
- 26505 W Ingleside Shore Rd
- 26618 W Ingleside Shore Rd
- 26474 W Ingleside Shore Rd
- 26460 W Ingleside Shore Rd
- 26477 W Ingleside Shore Rd
- 26636 W Ingleside Shore Rd