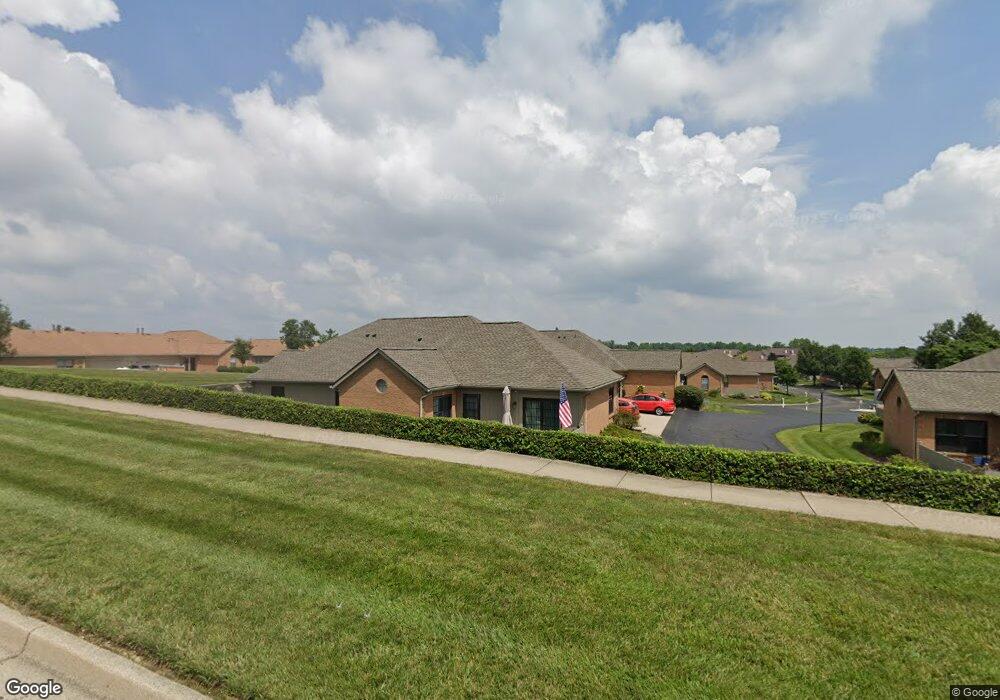
2655 Allister Cir Unit 23A Miamisburg, OH 45342
Estimated Value: $176,000 - $202,000
2
Beds
2
Baths
1,142
Sq Ft
$168/Sq Ft
Est. Value
About This Home
This home is located at 2655 Allister Cir Unit 23A, Miamisburg, OH 45342 and is currently estimated at $191,941, approximately $168 per square foot. 2655 Allister Cir Unit 23A is a home located in Montgomery County with nearby schools including Miamisburg High School, Bishop Leibold School, and Dayton Christian School.
Ownership History
Date
Name
Owned For
Owner Type
Purchase Details
Closed on
Oct 15, 2020
Sold by
Ricke Deanene G and Estate Of Marjorie Ann Gustin
Bought by
Nichols Rebecca R
Current Estimated Value
Home Financials for this Owner
Home Financials are based on the most recent Mortgage that was taken out on this home.
Original Mortgage
$107,290
Interest Rate
2.8%
Mortgage Type
New Conventional
Purchase Details
Closed on
Sep 30, 2002
Sold by
Little Rita G and Little Rita L
Bought by
Little Rita L and Little Rita G
Home Financials for this Owner
Home Financials are based on the most recent Mortgage that was taken out on this home.
Original Mortgage
$79,700
Interest Rate
6.34%
Purchase Details
Closed on
May 10, 2000
Sold by
Trickler Esther M and Trickler Esther M
Bought by
Little Rita G
Home Financials for this Owner
Home Financials are based on the most recent Mortgage that was taken out on this home.
Original Mortgage
$76,500
Interest Rate
8.13%
Create a Home Valuation Report for This Property
The Home Valuation Report is an in-depth analysis detailing your home's value as well as a comparison with similar homes in the area
Home Values in the Area
Average Home Value in this Area
Purchase History
| Date | Buyer | Sale Price | Title Company |
|---|---|---|---|
| Nichols Rebecca R | $134,900 | Landmark Ttl Agcy South Inc | |
| Little Rita L | -- | Sterling Land Title Agency I | |
| Little Rita G | $101,500 | -- |
Source: Public Records
Mortgage History
| Date | Status | Borrower | Loan Amount |
|---|---|---|---|
| Previous Owner | Nichols Rebecca R | $107,290 | |
| Previous Owner | Little Rita L | $79,700 | |
| Previous Owner | Little Rita G | $76,500 |
Source: Public Records
Tax History Compared to Growth
Tax History
| Year | Tax Paid | Tax Assessment Tax Assessment Total Assessment is a certain percentage of the fair market value that is determined by local assessors to be the total taxable value of land and additions on the property. | Land | Improvement |
|---|---|---|---|---|
| 2024 | $3,733 | $53,440 | $9,330 | $44,110 |
| 2023 | $3,733 | $53,440 | $9,330 | $44,110 |
| 2022 | $3,463 | $42,080 | $7,350 | $34,730 |
| 2021 | $3,345 | $42,080 | $7,350 | $34,730 |
| 2020 | $2,554 | $42,080 | $7,350 | $34,730 |
| 2019 | $2,271 | $35,610 | $5,250 | $30,360 |
| 2018 | $2,255 | $35,610 | $5,250 | $30,360 |
| 2017 | $2,241 | $35,610 | $5,250 | $30,360 |
| 2016 | $1,827 | $29,760 | $5,250 | $24,510 |
| 2015 | $1,796 | $29,760 | $5,250 | $24,510 |
| 2014 | $1,796 | $29,760 | $5,250 | $24,510 |
| 2012 | -- | $33,970 | $7,820 | $26,150 |
Source: Public Records
Map
Nearby Homes
- 9616 Wild Ginger Way
- 9528 Summer Wind Trail
- 2115 Autumn Haze Trail
- 2968 Asbury Ct
- 2378 Ferndown Dr
- 10001 Forestedge Ln
- 2540 Colinda Ct
- 9588 Tahoe Dr
- 9604 Tahoe Dr
- 9406 Tahoe Dr Unit 19406
- 1794 Placid Dr
- 9607 Olde Georgetown
- 3412 Old Lantern Ct
- 9553 Tahoe Dr
- 9540 Tahoe Dr
- 9747 Cobblewood Ct
- 9519 Tahoe Dr
- 9515 Tahoe Dr
- 10123 Heartwood Ct
- 1963 Waterstone Blvd Unit 104
- 2659 Allister Cir Unit 23C
- 2657 Allister Cir Unit 23D
- 2653 Allister Cir Unit 23B
- 2643 Allister Cir Unit 22A
- 2645 Allister Cir Unit 22D
- 2656 Allister Cir Unit 19A
- 2658 Allister Cir Unit 19D
- 2620 Allister Cir Unit 19C
- 2622 Allister Cir Unit 19B
- 2637 Allister Cir Unit 21C
- 2635 Allister Cir Unit 21D
- 2647 Allister Cir Unit 22C
- 2633 Allister Cir Unit 21A
- 2673 Allister Cir Unit 24B
- 2671 Allister Cir Unit 24A
- 2641 Allister Cir Unit 22B
- 2670 Allister Cir Unit 18D
- 2668 Allister Cir Unit 18B
- 2625 Allister Cir Unit 20D
- 2675 Allister Cir Unit 24D