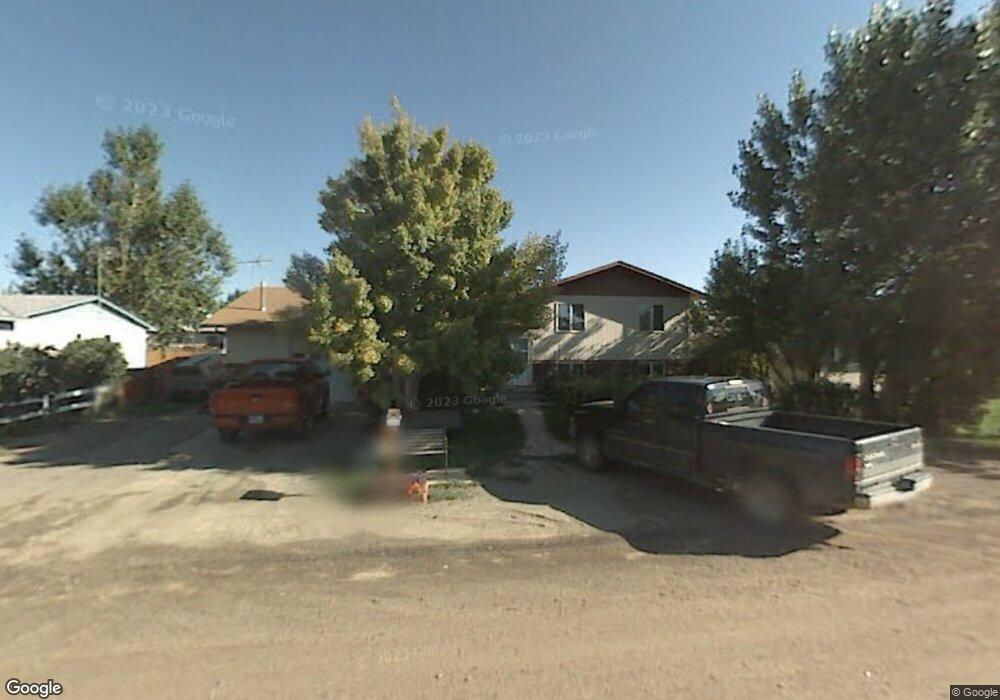
2655 Monroe St Laramie, WY 82070
Estimated Value: $384,000 - $434,000
4
Beds
3
Baths
1,512
Sq Ft
$268/Sq Ft
Est. Value
About This Home
This home is located at 2655 Monroe St, Laramie, WY 82070 and is currently estimated at $405,478, approximately $268 per square foot. 2655 Monroe St is a home located in Albany County with nearby schools including Velma Linford Elementary School, Laramie Middle School, and Laramie High School.
Ownership History
Date
Name
Owned For
Owner Type
Purchase Details
Closed on
Dec 11, 2020
Sold by
Schueder Derek and Schueder Jody
Bought by
Orr Jacob and Orr Mary
Current Estimated Value
Home Financials for this Owner
Home Financials are based on the most recent Mortgage that was taken out on this home.
Original Mortgage
$295,450
Outstanding Balance
$263,508
Interest Rate
2.8%
Mortgage Type
New Conventional
Estimated Equity
$141,970
Purchase Details
Closed on
Dec 13, 2007
Sold by
Wolfwalkeroakes Mary Ll and Ivanoff Mary L
Bought by
Ivanoff Mary L
Home Financials for this Owner
Home Financials are based on the most recent Mortgage that was taken out on this home.
Original Mortgage
$203,162
Interest Rate
6.27%
Mortgage Type
FHA
Purchase Details
Closed on
Jul 23, 2005
Sold by
Guernsey Peter Jay and Guernsey Nancy Jm
Bought by
Wolfwalkeroakes Mary L
Home Financials for this Owner
Home Financials are based on the most recent Mortgage that was taken out on this home.
Original Mortgage
$181,800
Interest Rate
8.35%
Mortgage Type
Adjustable Rate Mortgage/ARM
Create a Home Valuation Report for This Property
The Home Valuation Report is an in-depth analysis detailing your home's value as well as a comparison with similar homes in the area
Home Values in the Area
Average Home Value in this Area
Purchase History
| Date | Buyer | Sale Price | Title Company |
|---|---|---|---|
| Orr Jacob | -- | First American Title | |
| Ivanoff Mary L | -- | -- | |
| Wolfwalkeroakes Mary L | -- | -- |
Source: Public Records
Mortgage History
| Date | Status | Borrower | Loan Amount |
|---|---|---|---|
| Open | Orr Jacob | $295,450 | |
| Previous Owner | Ivanoff Mary L | $203,162 | |
| Previous Owner | Wolfwalkeroakes Mary L | $181,800 |
Source: Public Records
Tax History Compared to Growth
Tax History
| Year | Tax Paid | Tax Assessment Tax Assessment Total Assessment is a certain percentage of the fair market value that is determined by local assessors to be the total taxable value of land and additions on the property. | Land | Improvement |
|---|---|---|---|---|
| 2025 | $2,523 | $26,955 | $3,269 | $23,686 |
| 2024 | $2,523 | $34,558 | $4,191 | $30,367 |
| 2023 | $2,437 | $33,390 | $4,191 | $29,199 |
| 2022 | $2,349 | $32,176 | $4,191 | $27,985 |
| 2021 | $2,029 | $27,794 | $3,677 | $24,117 |
| 2020 | $1,805 | $24,722 | $3,084 | $21,638 |
| 2019 | $1,659 | $22,726 | $3,084 | $19,642 |
| 2018 | $1,627 | $22,286 | $2,775 | $19,511 |
| 2017 | $1,536 | $21,046 | $2,775 | $18,271 |
| 2016 | $1,519 | $20,808 | $2,775 | $18,033 |
| 2015 | $1,540 | $21,096 | $2,775 | $18,321 |
| 2014 | $1,512 | $20,708 | $0 | $0 |
Source: Public Records
Map
Nearby Homes
- 509 S Hayes St
- 2166 W Wyoming Ave Unit 29
- 2166 W Wyoming Ave Unit 25
- 2073 Monroe St
- 2075 Jefferson St
- 174 N Colorado Ave
- 541 S Johnson St
- 370 S Buchanan St
- 8 Star Struck Ln
- 627 S Colorado Ave
- 2260 Franklin St Unit 27
- 2260 Franklin St Unit 38
- 1990 Truman St
- 1965 Truman St
- 427 S Pierce St
- 1416 S Colorado Ave
- 1414 S Colorado Ave
- 1412 S Colorado Ave
- 1410 S Colorado Ave
- 529 S Pierce St
- 2569 Monroe St
- 2659 Monroe St
- 2656 Kennedy St
- 2660 Kennedy St
- 2570 Kennedy St
- 2663 Monroe St
- 2565 Monroe St
- 2566 Kennedy St
- 2664 Kennedy St
- 2652 Monroe St
- 305 Arthur St
- 2658 Monroe St
- 2561 Monroe St
- 2667 Monroe St
- 2569 Kennedy St
- 2655 Kennedy St
- 2668 Kennedy St
- 2562 Kennedy St
- 2659 Kennedy St
- 2664 Monroe St