Estimated Value: $526,000 - $574,000
3
Beds
3
Baths
3,123
Sq Ft
$178/Sq Ft
Est. Value
About This Home
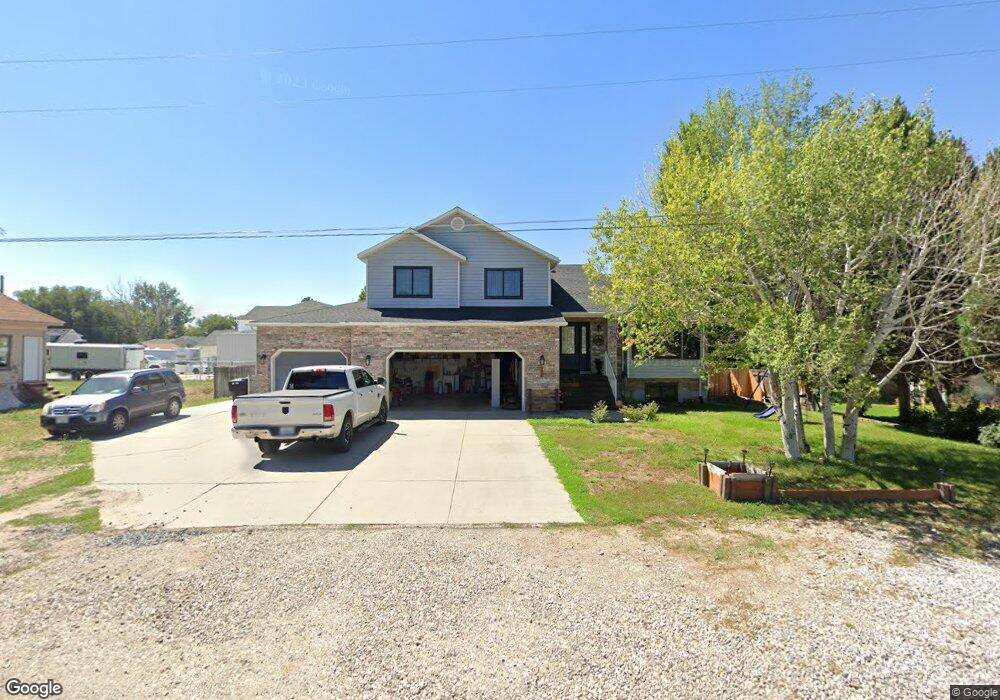
This home is located at 2655 N 4350 W, Ogden, UT 84404 and is currently estimated at $555,833, approximately $177 per square foot. 2655 N 4350 W is a home located in Weber County with nearby schools including Plain City School, Wahlquist Junior High School, and Fremont High School.
Ownership History
Date
Name
Owned For
Owner Type
Purchase Details
Closed on
May 3, 2018
Sold by
Stackhouse Randy L
Bought by
Stackhouse Randy L and Stackhouse Cecilia
Current Estimated Value
Home Financials for this Owner
Home Financials are based on the most recent Mortgage that was taken out on this home.
Original Mortgage
$338,351
Outstanding Balance
$291,666
Interest Rate
4.45%
Mortgage Type
VA
Estimated Equity
$264,167
Purchase Details
Closed on
Nov 23, 2011
Sold by
Poll Lindy D and Poll Cindy R
Bought by
Poll Cindy R and Poll Lindy D
Home Financials for this Owner
Home Financials are based on the most recent Mortgage that was taken out on this home.
Original Mortgage
$236,607
Interest Rate
4.25%
Mortgage Type
FHA
Create a Home Valuation Report for This Property
The Home Valuation Report is an in-depth analysis detailing your home's value as well as a comparison with similar homes in the area
Home Values in the Area
Average Home Value in this Area
Purchase History
| Date | Buyer | Sale Price | Title Company |
|---|---|---|---|
| Stackhouse Randy L | -- | Us Title Insurance Agency | |
| Stackhouse Randy L | -- | Security Title Of Davis Cnty | |
| Poll Cindy R | -- | First American Fashion Point |
Source: Public Records
Mortgage History
| Date | Status | Borrower | Loan Amount |
|---|---|---|---|
| Open | Stackhouse Randy L | $338,351 | |
| Previous Owner | Poll Cindy R | $236,607 |
Source: Public Records
Tax History Compared to Growth
Tax History
| Year | Tax Paid | Tax Assessment Tax Assessment Total Assessment is a certain percentage of the fair market value that is determined by local assessors to be the total taxable value of land and additions on the property. | Land | Improvement |
|---|---|---|---|---|
| 2025 | $367 | $530,267 | $150,488 | $379,779 |
| 2024 | $507 | $286,549 | $82,766 | $203,783 |
| 2023 | $2,619 | $266,750 | $74,631 | $192,119 |
| 2022 | $301 | $279,400 | $72,074 | $207,326 |
| 2021 | $295 | $398,000 | $62,281 | $335,719 |
| 2020 | $288 | $347,000 | $52,426 | $294,574 |
| 2019 | $288 | $313,000 | $47,915 | $265,085 |
| 2018 | $2,019 | $291,000 | $47,915 | $243,085 |
| 2017 | $1,750 | $235,000 | $42,409 | $192,591 |
| 2016 | $1,668 | $122,115 | $21,352 | $100,763 |
| 2015 | $1,584 | $112,493 | $21,352 | $91,141 |
| 2014 | $1,474 | $101,675 | $22,422 | $79,253 |
Source: Public Records
Map
Nearby Homes
- 2700 N 4200 W
- 2793 W 2775 N
- 2797 W 2775 N Unit 129
- 2782 W 2775 N Unit 105
- 2792 W 2775 N Unit 103
- 2787 W 2775 N Unit 127
- 2416 N 4275 W
- 4188 W 2875 N
- 3963 2800 North St
- 2131 N 4650 W
- 3966 W 2200 N
- 4210 W 1975 N
- 3622 W 2200 St N Unit 23
- 2834 N 5150 W
- 1885 N 4475 W
- 2255 N 3600 St W Unit 21
- 2233 N 3600 St W Unit 22
- 2741 N 3475 W
- 3462 W 2565 N
- 3594 W 2200 N Unit 3