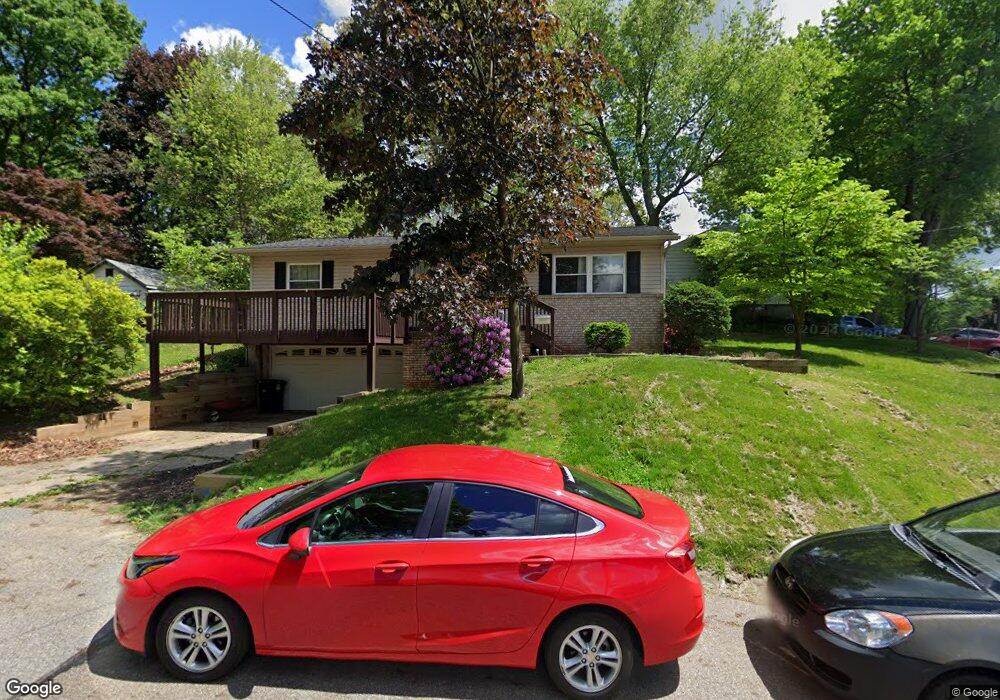
2655 Nesbitt Ave Akron, OH 44314
Kenmore NeighborhoodEstimated Value: $138,370 - $169,000
3
Beds
3
Baths
1,092
Sq Ft
$142/Sq Ft
Est. Value
About This Home
This home is located at 2655 Nesbitt Ave, Akron, OH 44314 and is currently estimated at $155,343, approximately $142 per square foot. 2655 Nesbitt Ave is a home located in Summit County with nearby schools including St. Francis de Sales School and Sam Salem Community Learning Center.
Ownership History
Date
Name
Owned For
Owner Type
Purchase Details
Closed on
May 13, 2011
Sold by
Secretary Of Housing & Urban Development
Bought by
Mceuen Victoria J
Current Estimated Value
Home Financials for this Owner
Home Financials are based on the most recent Mortgage that was taken out on this home.
Original Mortgage
$25,000
Outstanding Balance
$17,398
Interest Rate
4.91%
Mortgage Type
Purchase Money Mortgage
Estimated Equity
$137,945
Purchase Details
Closed on
Sep 10, 2010
Sold by
U S Bank N A
Bought by
The Secretary Of Housing & Urban Develop
Purchase Details
Closed on
Aug 19, 2010
Sold by
Hardesty Debbie L
Bought by
Us Bank Na
Purchase Details
Closed on
Sep 1, 1999
Sold by
Barnard Melissa R and Barnard Gregory R
Bought by
Hardesty Brian L and Hardesty Debbie L
Home Financials for this Owner
Home Financials are based on the most recent Mortgage that was taken out on this home.
Original Mortgage
$85,850
Interest Rate
7.77%
Mortgage Type
FHA
Create a Home Valuation Report for This Property
The Home Valuation Report is an in-depth analysis detailing your home's value as well as a comparison with similar homes in the area
Home Values in the Area
Average Home Value in this Area
Purchase History
| Date | Buyer | Sale Price | Title Company |
|---|---|---|---|
| Mceuen Victoria J | $27,050 | Attorney | |
| The Secretary Of Housing & Urban Develop | -- | Attorney | |
| Us Bank Na | $58,000 | None Available | |
| Hardesty Brian L | $93,000 | Approved Statewide Title Age |
Source: Public Records
Mortgage History
| Date | Status | Borrower | Loan Amount |
|---|---|---|---|
| Open | Mceuen Victoria J | $25,000 | |
| Previous Owner | Hardesty Brian L | $85,850 |
Source: Public Records
Tax History Compared to Growth
Tax History
| Year | Tax Paid | Tax Assessment Tax Assessment Total Assessment is a certain percentage of the fair market value that is determined by local assessors to be the total taxable value of land and additions on the property. | Land | Improvement |
|---|---|---|---|---|
| 2025 | $2,160 | $38,574 | $5,600 | $32,974 |
| 2024 | $2,160 | $38,574 | $5,600 | $32,974 |
| 2023 | $2,160 | $38,574 | $5,600 | $32,974 |
| 2022 | $2,015 | $28,085 | $4,057 | $24,028 |
| 2021 | $2,017 | $28,085 | $4,057 | $24,028 |
| 2020 | $2,116 | $28,090 | $4,060 | $24,030 |
| 2019 | $2,267 | $27,670 | $4,060 | $23,610 |
| 2018 | $2,240 | $27,670 | $4,060 | $23,610 |
| 2017 | $2,198 | $27,670 | $4,060 | $23,610 |
| 2016 | $2,327 | $28,430 | $4,060 | $24,370 |
| 2015 | $2,198 | $28,430 | $4,060 | $24,370 |
| 2014 | $2,181 | $28,430 | $4,060 | $24,370 |
| 2013 | $2,077 | $26,800 | $4,060 | $22,740 |
Source: Public Records
Map
Nearby Homes
- 2531 Pelton Ave
- 2785 Nesmith Lake Blvd
- 2513 Christensen Ave
- 364 Rexford St
- 2365 Pelton Ave
- 363 Lockwood St
- 355 Lockwood St
- 32 Joyce Ave
- 0 Joyce Ave NW Unit 35 5043152
- 0 Joyce Ave NW Unit 34 5043158
- 2784 Conway St
- 838 Stanwood Ave
- 2984 Manchester Rd
- 2836 Unclmorse Ave
- 860 Sutherland Ave
- 451 Allenford St
- 590 Flora Ave
- 894 Sutherland Ave
- 636 Flora Ave
- 594 Shook Rd
- 2872 Nesmith Lake Blvd
- 2645 Nesbitt Ave
- 2860 Nesmith Lake Blvd
- 2888 Nesmith Lake Blvd
- 2885 Nesmith Lake Blvd
- 2656 Pelton Ave
- 2639 Nesbitt Ave
- 2648 Pelton Ave
- 2875 Nesmith Lake Blvd
- 2889 Nesmith Lake Blvd
- 2869 Nesmith Lake Blvd
- 2644 Pelton Ave
- 506 Brenneman Blvd
- 500 Brenneman Blvd
- 2906 Nesmith Lake Blvd
- 2861 Nesmith Lake Blvd
- 494 Brenneman Blvd
- 2626 Nesbitt Ave
- 2653 Pelton Ave
- 2853 Nesmith Lake Blvd