
Landlord's Agent in 2025
Pamela Jones
Long & Foster
(703) 726-3405
119 Total Sales


Estimated Value: $355,000 - $371,000
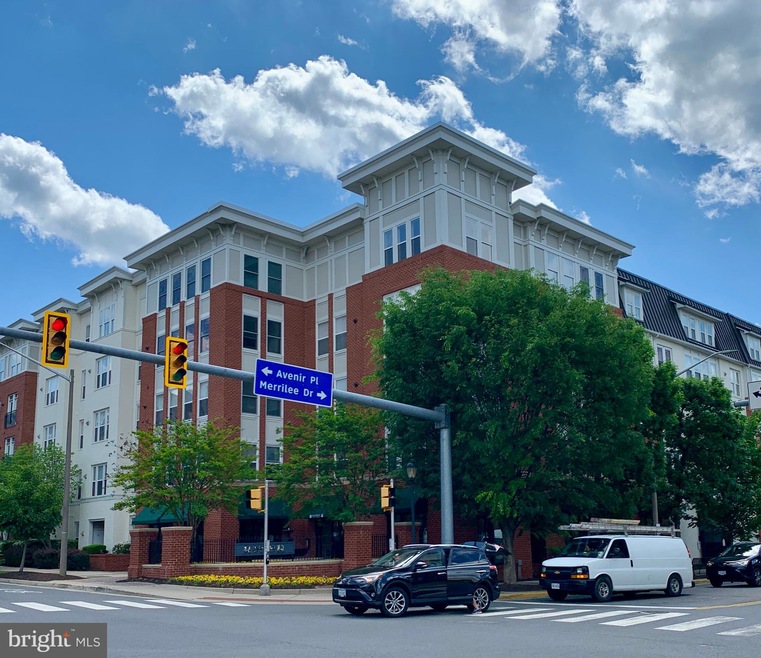
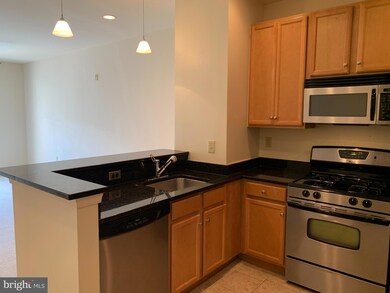
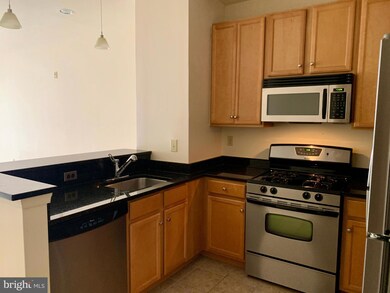
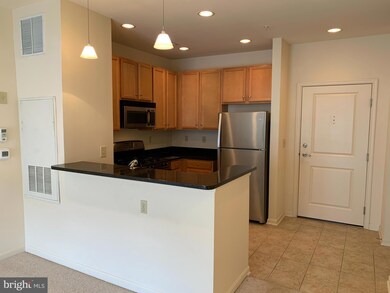
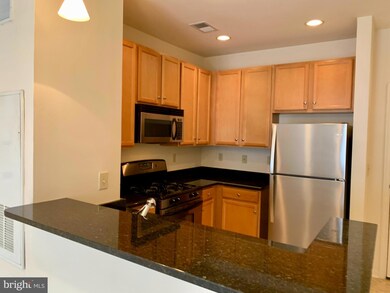
Halstead At The Metro Great location directly across from the Dunn Loring Metro and just steps to the Mosaic District shops, Target, Harris Teeter, dining, and night life! This fantastic 1 bedroom 1 bath condo is just waiting for you. Features include stainless steel appliance, full size washer & dryer, tons of natural light, balcony and 1 garage parking space.
Water and trash included in the rent. Available immediately Sorry no pets
Great Amenity with State-of-the-Art Fitness Center, Business Center, Conference Space, Library, Party Room, Indoor Basketball Court, and Outdoor Swimming Pool, and much more!
* Lockbox on Railing at Entrance Garage. **
Great location-easy access to Tysons, I-495, INOVA, Mosaic District, shops and more! Easy access to transportation.
Last Agent to Rent the Property
(703) 726-3405 pamela.jones@lnf.com Long & Foster Real Estate, Inc. License #0225003072 Listed on: 05/05/2025
Last Renter's Agent
(703) 424-1980 nazneen@longandfoster.com Long & Foster Real Estate, Inc. License #0225206357
| Date | Buyer | Sale Price | Title Company |
|---|---|---|---|
| Kkj Inc | $215,000 | -- | |
| Shin David H | $288,850 | -- |
| Date | Status | Borrower | Loan Amount |
|---|---|---|---|
| Previous Owner | Shin David H | $231,080 |
| Date | Event | Price | List to Sale | Price per Sq Ft |
|---|---|---|---|---|
| 06/02/2025 06/02/25 | Rented | $2,100 | 0.0% | -- |
| 05/28/2025 05/28/25 | Under Contract | -- | -- | -- |
| 05/16/2025 05/16/25 | Price Changed | $2,100 | -4.5% | $3 / Sq Ft |
| 05/05/2025 05/05/25 | For Rent | $2,200 | -- | -- |
| Year | Tax Paid | Tax Assessment Tax Assessment Total Assessment is a certain percentage of the fair market value that is determined by local assessors to be the total taxable value of land and additions on the property. | Land | Improvement |
|---|---|---|---|---|
| 2025 | $3,786 | $356,240 | $71,000 | $285,240 |
| 2024 | $3,786 | $326,830 | $65,000 | $261,830 |
| 2023 | $3,581 | $317,310 | $63,000 | $254,310 |
| 2022 | $3,722 | $325,450 | $65,000 | $260,450 |
| 2021 | $3,937 | $335,520 | $67,000 | $268,520 |
| 2020 | $3,545 | $299,570 | $60,000 | $239,570 |
| 2019 | $3,464 | $292,730 | $59,000 | $233,730 |
| 2018 | $3,366 | $292,730 | $59,000 | $233,730 |
| 2017 | $3,268 | $281,470 | $56,000 | $225,470 |
| 2016 | $3,299 | $284,750 | $57,000 | $227,750 |
| 2015 | $3,085 | $276,460 | $55,000 | $221,460 |
| 2014 | $2,894 | $259,940 | $52,000 | $207,940 |
Landlord's Agent in 2025
Pamela Jones
Long & Foster
(703) 726-3405
119 Total Sales
Tenant's Agent in 2025
Nazneen Kavarana
Long & Foster
(703) 424-1980
20 Total Sales
Source: Bright MLS
MLS Number: VAFX2238766
APN: 0491-29-0318
Disclaimer: Certain information contained herein is derived from information provided by parties other than Homes.com. All information provided is deemed reliable, but is not guaranteed to be accurate and should be independently verified.
![]() The data relating to real estate for sale on this website appears in part through the BRIGHT Internet Data Exchange program, a voluntary cooperative exchange of property listing data between licensed real estate brokerage firms, and is provided by BRIGHT through a licensing agreement.
The data relating to real estate for sale on this website appears in part through the BRIGHT Internet Data Exchange program, a voluntary cooperative exchange of property listing data between licensed real estate brokerage firms, and is provided by BRIGHT through a licensing agreement.
Listing information is from various brokers who participate in the Bright MLS IDX program and not all listings may be visible on the site.
The property information being provided on or through the website is for the personal, non-commercial use of consumers and such information may not be used for any purpose other than to identify prospective properties consumers may be interested in purchasing.
Some properties which appear for sale on the website may no longer be available because they are for instance, under contract, sold or are no longer being offered for sale.
Property information displayed is deemed reliable but is not guaranteed.
Copyright 2025 Bright MLS, Inc.