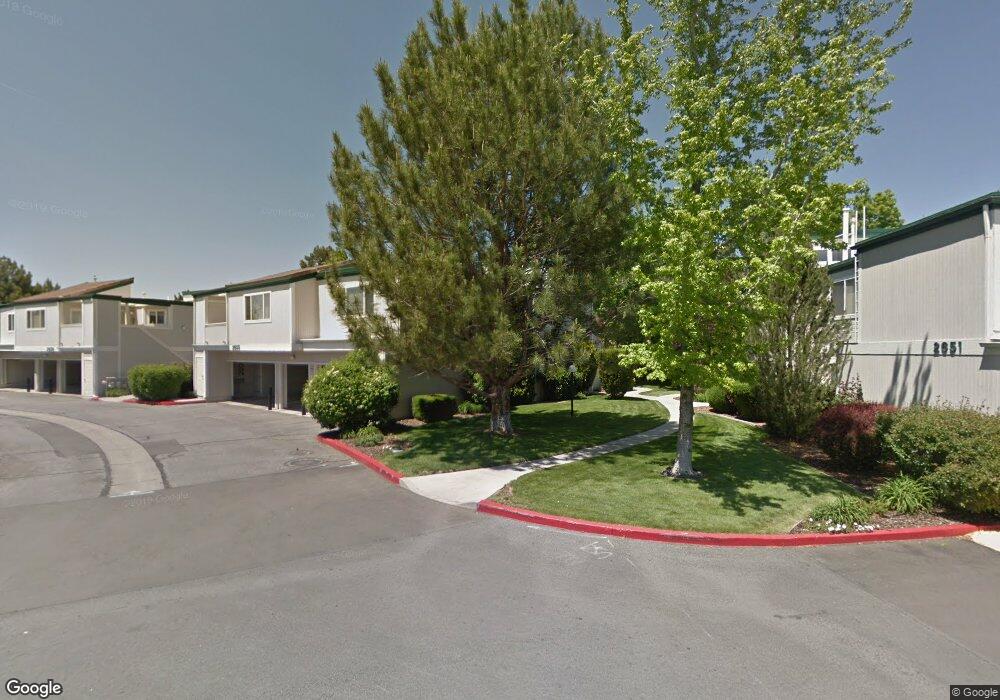
2655 Sycamore Glen Dr Unit 2 Sparks, NV 89434
Reed NeighborhoodEstimated Value: $248,878 - $278,000
2
Beds
2
Baths
824
Sq Ft
$322/Sq Ft
Est. Value
About This Home
This home is located at 2655 Sycamore Glen Dr Unit 2, Sparks, NV 89434 and is currently estimated at $265,470, approximately $322 per square foot. 2655 Sycamore Glen Dr Unit 2 is a home located in Washoe County with nearby schools including Lloyd Diedrichsen Elementary School, Lou Mendive Middle School, and Edward C Reed High School.
Ownership History
Date
Name
Owned For
Owner Type
Purchase Details
Closed on
Dec 16, 1998
Sold by
Mazzanti Mary L
Bought by
Mary L Mazzanti Living Trust
Current Estimated Value
Home Financials for this Owner
Home Financials are based on the most recent Mortgage that was taken out on this home.
Original Mortgage
$28,720
Outstanding Balance
$6,266
Interest Rate
6.86%
Estimated Equity
$259,204
Purchase Details
Closed on
Aug 26, 1996
Sold by
Mazzanti Mary Lillian
Bought by
Mary Lillian Mazzanti Living Trust
Purchase Details
Closed on
Apr 13, 1995
Sold by
Heather Investments Inc
Bought by
Mazzaniti Mary L
Home Financials for this Owner
Home Financials are based on the most recent Mortgage that was taken out on this home.
Original Mortgage
$30,000
Interest Rate
8.6%
Create a Home Valuation Report for This Property
The Home Valuation Report is an in-depth analysis detailing your home's value as well as a comparison with similar homes in the area
Home Values in the Area
Average Home Value in this Area
Purchase History
| Date | Buyer | Sale Price | Title Company |
|---|---|---|---|
| Mary L Mazzanti Living Trust | -- | First American Title Co | |
| Mazzanti Mary L | -- | First American Title Co | |
| Mary Lillian Mazzanti Living Trust | -- | -- | |
| Mazzaniti Mary L | $80,000 | Western Title Company |
Source: Public Records
Mortgage History
| Date | Status | Borrower | Loan Amount |
|---|---|---|---|
| Open | Mazzanti Mary L | $28,720 | |
| Closed | Mazzaniti Mary L | $30,000 |
Source: Public Records
Tax History Compared to Growth
Tax History
| Year | Tax Paid | Tax Assessment Tax Assessment Total Assessment is a certain percentage of the fair market value that is determined by local assessors to be the total taxable value of land and additions on the property. | Land | Improvement |
|---|---|---|---|---|
| 2026 | $1,025 | $45,284 | $21,735 | $23,549 |
| 2025 | $923 | $45,559 | $21,735 | $23,824 |
| 2024 | $923 | $44,001 | $20,160 | $23,841 |
| 2023 | $856 | $41,875 | $20,755 | $21,120 |
| 2022 | $793 | $35,265 | $16,940 | $18,325 |
| 2021 | $734 | $31,182 | $12,775 | $18,407 |
| 2020 | $688 | $31,689 | $13,020 | $18,669 |
| 2019 | $668 | $30,765 | $12,355 | $18,410 |
| 2018 | $637 | $25,239 | $7,140 | $18,099 |
| 2017 | $620 | $25,242 | $7,175 | $18,067 |
| 2016 | $605 | $25,057 | $6,475 | $18,582 |
| 2015 | $604 | $24,033 | $4,970 | $19,063 |
| 2014 | $586 | $16,698 | $3,535 | $13,163 |
| 2013 | -- | $15,661 | $2,625 | $13,036 |
Source: Public Records
Map
Nearby Homes
- 2679 Sycamore Glen Dr Unit 4
- 2407 Sunny Slope Dr Unit 1
- 2252 Sycamore Glen Dr
- 1990 Fargo Way
- 1280 O'Callaghan Dr
- 1970 Woodhaven Ln
- 1029 Baywood Dr Unit D
- 914 Glen Martin Dr
- 913 Glen Molly Dr
- 2688 Laguna Way
- 1688 Round Mountain Cir
- 1770 Burnside Dr
- 1290 Highgate Ct
- 3127 Montezuma Way
- 1544 Woodhaven Ln
- 1675 Round Mountain Cir
- 1973 Rio Tinto Dr
- 1069 Palmwood Dr
- 3345 Groom Way
- 1332 Coachman Ct
- 2655 Sycamore Glen Dr
- 2655 Sycamore Glen Dr Unit 3
- 2655 Sycamore Glen Dr Unit 1
- 2655 Sycamore Glen Dr Unit 4
- 2655 Sycamore Glen Dr Unit 5
- 2659 Sycamore Glen Dr
- 2659 Sycamore Glen Dr Unit 2659 Sycamore Glen D
- 2659 Sycamore Glen Dr
- 2659 Sycamore Glen Dr Unit 5
- 2659 Sycamore Glen Dr Unit 1
- 2659 Sycamore Glen Dr Unit 3
- 2651 Sycamore Glen Dr Unit 1
- 2651 Sycamore Glen Dr Unit 5
- 2651 Sycamore Glen Dr
- 2651 Sycamore Glen Dr Unit 2
- 2651 Sycamore Glen Dr Unit 4
- 2651 Sycamore Glen Dr Unit 3
- 2659 Sycamore Glen #3 Unit 3
- 2649 Sunny Slope Dr Unit 3
- 2649 Sunny Slope Dr Unit 5