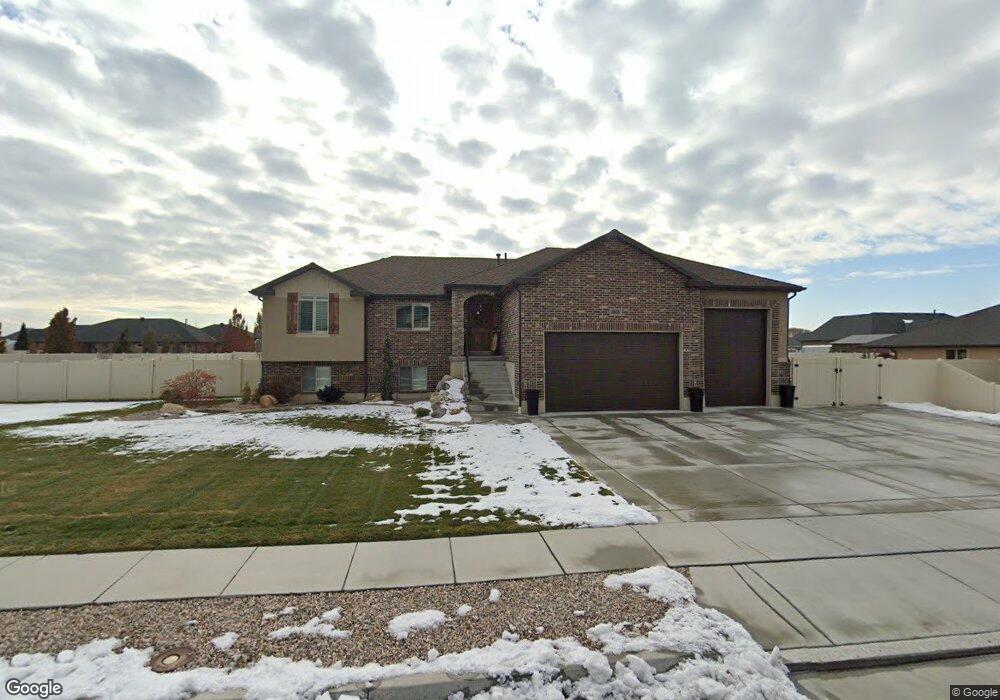
2655 W 2275 N Farr West, UT 84404
Estimated Value: $677,000 - $733,000
6
Beds
4
Baths
3,212
Sq Ft
$218/Sq Ft
Est. Value
About This Home
This home is located at 2655 W 2275 N, Farr West, UT 84404 and is currently estimated at $701,358, approximately $218 per square foot. 2655 W 2275 N is a home located in Weber County with nearby schools including Farr West Elementary School, Wahlquist Junior High School, and Fremont High School.
Ownership History
Date
Name
Owned For
Owner Type
Purchase Details
Closed on
Mar 20, 2018
Sold by
Schoeneman Randall W
Bought by
Schoeneman Randall W and Schoeneman Laralee
Current Estimated Value
Home Financials for this Owner
Home Financials are based on the most recent Mortgage that was taken out on this home.
Original Mortgage
$396,000
Outstanding Balance
$338,857
Interest Rate
4.32%
Mortgage Type
New Conventional
Estimated Equity
$362,501
Purchase Details
Closed on
Mar 16, 2018
Sold by
Spendlove Jacob Lee and Spendlove Kimberly
Bought by
Schoeneman Randall W
Home Financials for this Owner
Home Financials are based on the most recent Mortgage that was taken out on this home.
Original Mortgage
$396,000
Outstanding Balance
$338,857
Interest Rate
4.32%
Mortgage Type
New Conventional
Estimated Equity
$362,501
Purchase Details
Closed on
Dec 4, 2014
Sold by
Mountain View Title & Escrow Inc
Bought by
Mac Builders Inc
Create a Home Valuation Report for This Property
The Home Valuation Report is an in-depth analysis detailing your home's value as well as a comparison with similar homes in the area
Home Values in the Area
Average Home Value in this Area
Purchase History
| Date | Buyer | Sale Price | Title Company |
|---|---|---|---|
| Schoeneman Randall W | -- | Mountain View Title | |
| Schoeneman Randall W | -- | Stewart Title Ins Agency | |
| Mac Builders Inc | -- | Mountain View Title |
Source: Public Records
Mortgage History
| Date | Status | Borrower | Loan Amount |
|---|---|---|---|
| Open | Schoeneman Randall W | $396,000 |
Source: Public Records
Tax History Compared to Growth
Tax History
| Year | Tax Paid | Tax Assessment Tax Assessment Total Assessment is a certain percentage of the fair market value that is determined by local assessors to be the total taxable value of land and additions on the property. | Land | Improvement |
|---|---|---|---|---|
| 2025 | $3,794 | $662,033 | $200,000 | $462,033 |
| 2024 | $3,762 | $367,399 | $109,858 | $257,541 |
| 2023 | $3,576 | $345,400 | $109,655 | $235,745 |
| 2022 | $3,837 | $378,950 | $98,890 | $280,060 |
| 2021 | $3,234 | $539,000 | $104,859 | $434,141 |
| 2020 | $2,979 | $455,000 | $84,870 | $370,130 |
| 2019 | $2,869 | $414,000 | $84,931 | $329,069 |
| 2018 | $2,823 | $390,000 | $84,931 | $305,069 |
| 2017 | $2,567 | $344,000 | $77,925 | $266,075 |
| 2016 | $2,288 | $165,676 | $35,961 | $129,715 |
| 2015 | $917 | $65,383 | $65,383 | $0 |
Source: Public Records
Map
Nearby Homes
- 2172 N 2625 W
- 2673 W 2125 N
- 2124 Heritage Dr
- 2307 N 2850 W
- 2068 N 2850 W
- 2176 N 2900 W
- 3047 N 2875 W Unit 7
- 2705 2825 W Unit 67
- 2540 W 2575 N
- 2495 N 2850 W
- 2443 W 2950 N Unit 99
- 2443 W 2950 N
- 2950 W 1975 N
- 2801 W 1900 N
- 2730 N 2775 W Unit 113
- 2788 W 2775 N Unit 104
- 2405 W 2825 N
- 2081 W 1575 N Unit 127
- 2442 W 2850 N
- 4195 W 1575 N Unit 204
- 2641 W 2275 N
- 2669 W 2275 N Unit 40
- 2652 W 2225 N
- 2638 W 2275 N
- 2668 W 2275 N
- 2683 W 2275 N
- 2624 W 2225 N
- 2680 W 2225 N
- 2624 W 2275 N Unit 32
- 2655 W 2225 N
- 2637 W 2325 N
- 2653 W 2325 N
- 2653 W 2325 N Unit 159
- 2641 W 2225 N Unit 12
- 2669 W 2225 N
- 1593 2275 N
- 2613 W 2275 N
- 2619 W 2325 N
- 2252 N 2700 W
- 2657 W 2325 N