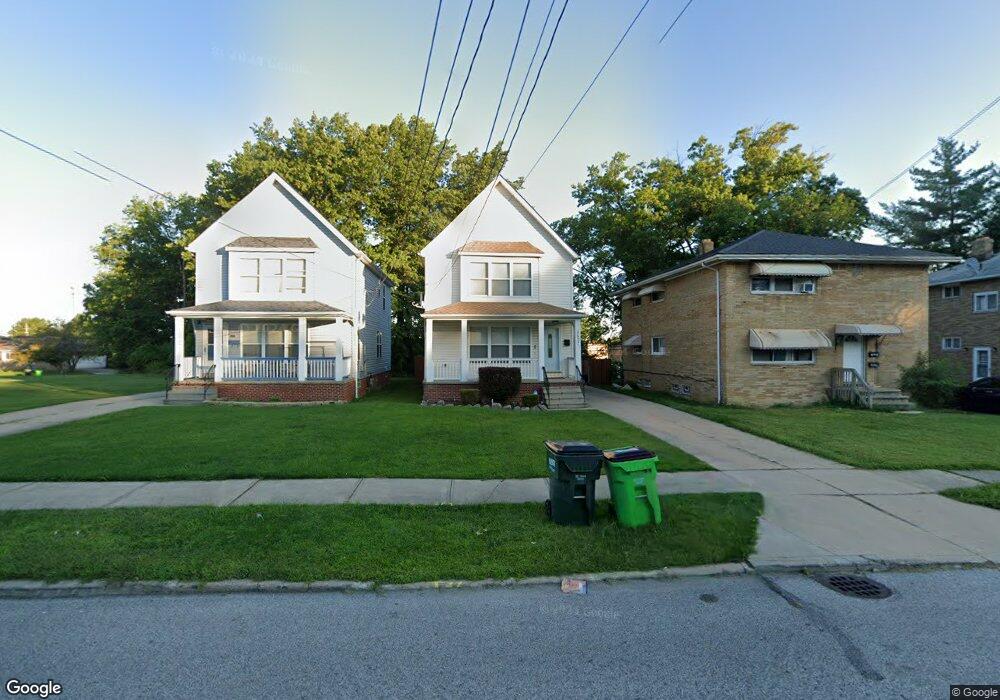
26551 Brush Ave Euclid, OH 44132
Estimated Value: $89,000 - $178,443
3
Beds
3
Baths
1,565
Sq Ft
$97/Sq Ft
Est. Value
About This Home
This home is located at 26551 Brush Ave, Euclid, OH 44132 and is currently estimated at $151,361, approximately $96 per square foot. 26551 Brush Ave is a home located in Cuyahoga County with nearby schools including Bluestone Elementary School, Euclid High School, and All Saints of St. John Vianney School.
Ownership History
Date
Name
Owned For
Owner Type
Purchase Details
Closed on
Sep 16, 2013
Sold by
Katsaris Chris and Katsaris Crystal
Bought by
26551 Brush Llc
Current Estimated Value
Purchase Details
Closed on
Jun 10, 2010
Sold by
745 Special Assets Llc
Bought by
Katsaris Chris and Katsaris Crystal
Purchase Details
Closed on
Apr 4, 2008
Sold by
Mcculler Matthew
Bought by
745 Special Assets Llc
Purchase Details
Closed on
May 23, 1997
Sold by
Levin Maxine G
Bought by
Fundamental Investments Inc
Purchase Details
Closed on
Dec 9, 1992
Sold by
Sill Robert L
Bought by
Sill, Alan Robert - Trustee
Purchase Details
Closed on
Apr 26, 1990
Sold by
Levin Robert M
Bought by
Sill Robert L
Purchase Details
Closed on
May 19, 1976
Sold by
Levin Maxine G
Bought by
Levin Robert M
Purchase Details
Closed on
Aug 13, 1975
Sold by
Levin Robert M
Bought by
Levin Maxine G
Purchase Details
Closed on
Jan 1, 1975
Bought by
Levin Robert M
Create a Home Valuation Report for This Property
The Home Valuation Report is an in-depth analysis detailing your home's value as well as a comparison with similar homes in the area
Home Values in the Area
Average Home Value in this Area
Purchase History
| Date | Buyer | Sale Price | Title Company |
|---|---|---|---|
| 26551 Brush Llc | -- | None Available | |
| Katsaris Chris | $35,000 | Oldstone Title | |
| 745 Special Assets Llc | $83,334 | Attorney | |
| Fundamental Investments Inc | $17,400 | -- | |
| Sill, Alan Robert - Trustee | -- | -- | |
| Sill Robert L | -- | -- | |
| Levin Robert M | -- | -- | |
| Levin Maxine G | -- | -- | |
| Levin Robert M | -- | -- |
Source: Public Records
Tax History Compared to Growth
Tax History
| Year | Tax Paid | Tax Assessment Tax Assessment Total Assessment is a certain percentage of the fair market value that is determined by local assessors to be the total taxable value of land and additions on the property. | Land | Improvement |
|---|---|---|---|---|
| 2024 | $3,765 | $54,250 | $6,300 | $47,950 |
| 2023 | $2,632 | $29,720 | $5,080 | $24,640 |
| 2022 | $2,574 | $29,720 | $5,080 | $24,640 |
| 2021 | $2,864 | $29,720 | $5,080 | $24,640 |
| 2020 | $2,408 | $22,510 | $3,850 | $18,660 |
| 2019 | $2,167 | $64,300 | $11,000 | $53,300 |
| 2018 | $2,153 | $22,510 | $3,850 | $18,660 |
| 2017 | $2,286 | $19,640 | $3,190 | $16,450 |
| 2016 | $2,291 | $19,640 | $3,190 | $16,450 |
| 2015 | $2,441 | $19,640 | $3,190 | $16,450 |
| 2014 | $2,441 | $23,110 | $3,750 | $19,360 |
Source: Public Records
Map
Nearby Homes
- 26982 Tungsten Rd
- 1670 Hillandale Dr
- 1507 E 256th St
- 28030 Coolidge Dr
- 127 Brush Rd
- 1523 Babbitt Rd
- 1468 E 252nd St
- 1467 E 250th St
- 164 Richmond Rd
- 25151 Euclid Ave
- 1474 E 248th St
- 1501 E 248th St
- 1498 E 248th St
- 24971 Euclid Ave
- 860 E 245th St
- 1333 Craneing Rd
- 911 Babbitt Rd
- 825 E 256th St
- 26268 Leslie Ave
- 1790 Skyline Dr
- 26541 Brush Ave
- 26601 Brush Ave
- 26601 Brush Ave Unit 1
- 26601 Brush Ave Unit 2
- 26631 Brush Ave
- 26491 Brush Ave
- E 264th St
- 26550 Brush Ave
- 26540 Brush Ave
- 26600 Brush Ave
- 26510 Brush Ave
- 26630 Brush Ave
- 26500 Brush Ave
- 26451 Brush Ave
- 26660 Tungsten Rd Unit 102
- 26650 Brush Ave
- 26700 Brush Ave
- 26750 Brush Ave
- 1396 E 264th St
- 26680 Tungsten Rd