2657 Five Forks Rd Shellman, GA 39886
Estimated Value: $83,937 - $108,000
Studio
--
Bath
1,216
Sq Ft
$79/Sq Ft
Est. Value
About This Home
This home is located at 2657 Five Forks Rd, Shellman, GA 39886 and is currently estimated at $96,484, approximately $79 per square foot. 2657 Five Forks Rd is a home with nearby schools including Randolph County Elementary School, Randolph Clay Middle School, and Randolph Clay High School.
Ownership History
Date
Name
Owned For
Owner Type
Purchase Details
Closed on
May 9, 2024
Sold by
Curry Kimmie Oliver
Bought by
Mathews Curry Vincent
Current Estimated Value
Home Financials for this Owner
Home Financials are based on the most recent Mortgage that was taken out on this home.
Original Mortgage
$69,551
Outstanding Balance
$68,576
Interest Rate
6.88%
Mortgage Type
New Conventional
Estimated Equity
$27,908
Purchase Details
Closed on
Apr 25, 2022
Sold by
Thomas Pamela Clayton
Bought by
Curry Kimmie Oliver
Purchase Details
Closed on
Oct 1, 2019
Sold by
Milliron Edward
Bought by
Thomas Douglas A and Thomas Pamela C
Purchase Details
Closed on
Jul 30, 2001
Sold by
Curry James R and Curry Iii
Bought by
Thomas Douglas A
Purchase Details
Closed on
Nov 25, 1992
Bought by
Curry James R and Curry Iii
Create a Home Valuation Report for This Property
The Home Valuation Report is an in-depth analysis detailing your home's value as well as a comparison with similar homes in the area
Home Values in the Area
Average Home Value in this Area
Purchase History
| Date | Buyer | Sale Price | Title Company |
|---|---|---|---|
| Mathews Curry Vincent | $75,000 | -- | |
| Curry Kimmie Oliver | $75,000 | -- | |
| Thomas Douglas A | -- | -- | |
| Thomas Douglas A | -- | -- | |
| Thomas Douglas A | $47,500 | -- | |
| Thomas Douglas A | $47,500 | -- | |
| Curry James R | $21,000 | -- | |
| Curry James R | $21,000 | -- |
Source: Public Records
Mortgage History
| Date | Status | Borrower | Loan Amount |
|---|---|---|---|
| Open | Mathews Curry Vincent | $69,551 |
Source: Public Records
Tax History
| Year | Tax Paid | Tax Assessment Tax Assessment Total Assessment is a certain percentage of the fair market value that is determined by local assessors to be the total taxable value of land and additions on the property. | Land | Improvement |
|---|---|---|---|---|
| 2024 | $1,401 | $33,212 | $4,000 | $29,212 |
| 2023 | $1,175 | $33,212 | $4,000 | $29,212 |
| 2022 | $1,210 | $34,204 | $4,000 | $30,204 |
| 2021 | $372 | $22,356 | $4,010 | $18,346 |
| 2020 | $395 | $22,356 | $4,010 | $18,346 |
| 2019 | $393 | $22,356 | $4,010 | $18,346 |
| 2018 | $789 | $22,356 | $4,010 | $18,346 |
| 2017 | $360 | $22,356 | $4,010 | $18,346 |
| 2016 | $325 | $20,316 | $1,970 | $18,346 |
| 2015 | -- | $20,316 | $1,970 | $18,346 |
| 2014 | -- | $19,767 | $1,970 | $17,797 |
| 2013 | -- | $19,767 | $1,970 | $17,796 |
Source: Public Records
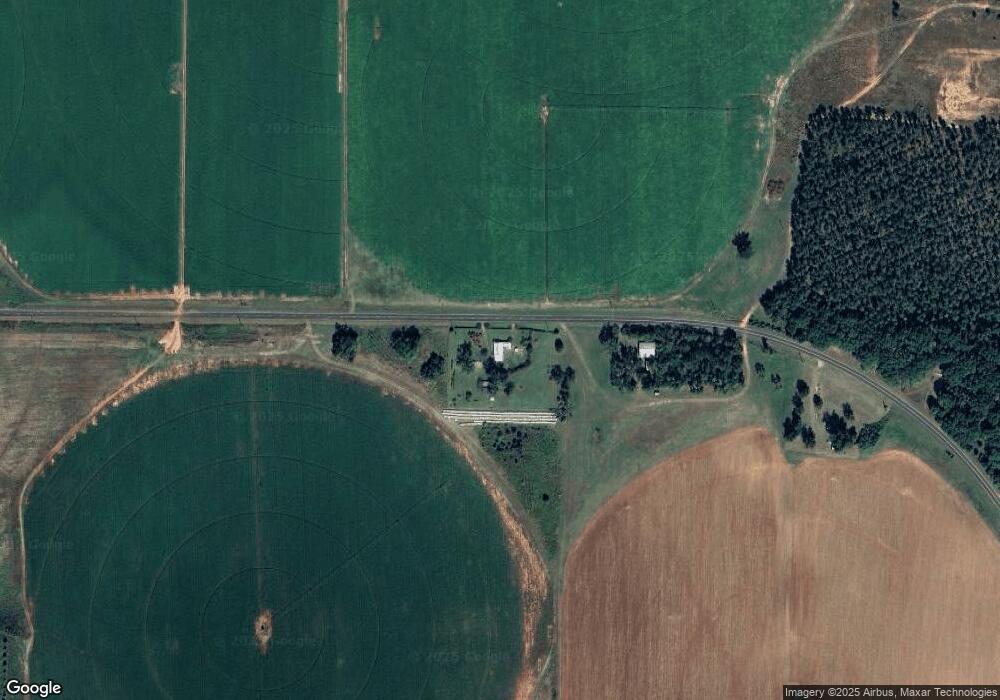
Map
Nearby Homes
- 3109 Calhoun St
- 48 Cheney St
- 0 Carver St
- 5147 Doverel Hwy
- Sam Bentley Rd
- Pierce Rd
- 3418 New Hope Trail
- 13XX Graves Hwy
- 00 Hwy 41
- 300 Five Forks Rd
- 145 Pearson Dr SW
- 361/552 NW Tenth Ave
- 229 7th Ave NW
- 226 N Main St
- 414 2nd Ave SE
- 411 E Lee St
- 527 Orange St NE
- 567 E Lee St
- 550 Orange St NE
- 707 Johnson St SE
Your Personal Tour Guide
Ask me questions while you tour the home.