Estimated Value: $328,000 - $370,000
4
Beds
3
Baths
2,256
Sq Ft
$154/Sq Ft
Est. Value
About This Home
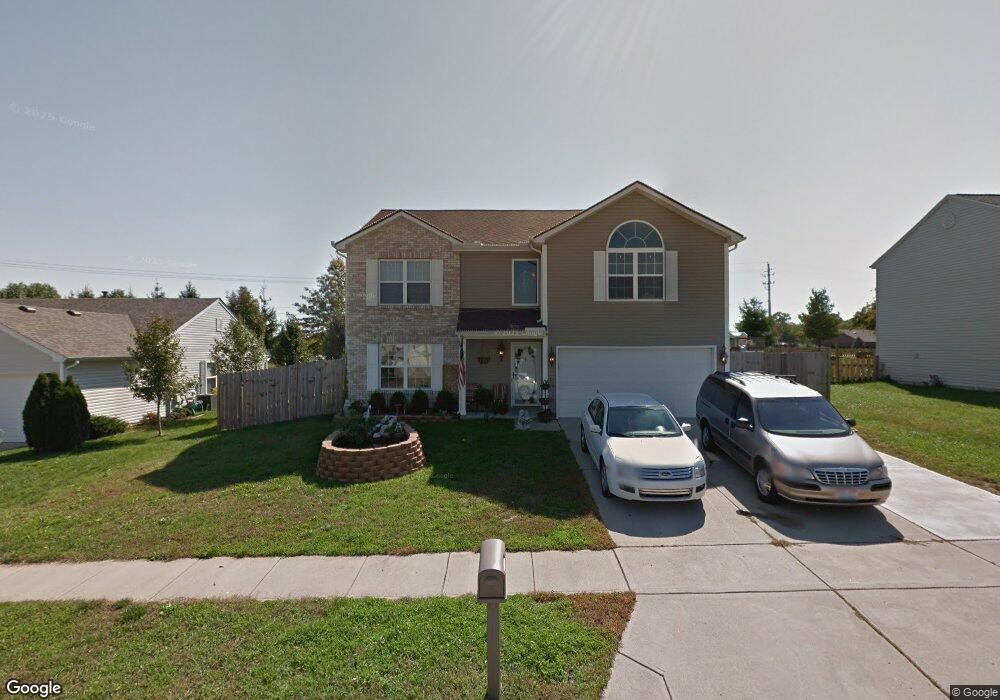
This home is located at 2657 Greystoke Ct, Xenia, OH 45385 and is currently estimated at $347,291, approximately $153 per square foot. 2657 Greystoke Ct is a home located in Greene County with nearby schools including Xenia High School, Summit Academy Community School for Alternative Learners - Xenia, and Legacy Christian Academy.
Ownership History
Date
Name
Owned For
Owner Type
Purchase Details
Closed on
Apr 16, 2021
Sold by
Lombardelli Michael E and Lombardelli Teresa A
Bought by
Morrison Kia and Morrison Michael
Current Estimated Value
Home Financials for this Owner
Home Financials are based on the most recent Mortgage that was taken out on this home.
Original Mortgage
$248,417
Interest Rate
2.9%
Mortgage Type
FHA
Purchase Details
Closed on
Apr 16, 2019
Sold by
Lombardelli Michael E and Lombardelli Michael Edward
Bought by
Lombardelli Michael E and Lombardelli Teresa A
Purchase Details
Closed on
Aug 23, 2004
Sold by
Bailey Lora J
Bought by
Bailey Michael E
Purchase Details
Closed on
Apr 25, 2001
Sold by
Crossmann Communities Of Ohio
Bought by
Bailey Michael E and Bailey Lora J
Home Financials for this Owner
Home Financials are based on the most recent Mortgage that was taken out on this home.
Original Mortgage
$140,893
Interest Rate
6.99%
Mortgage Type
FHA
Create a Home Valuation Report for This Property
The Home Valuation Report is an in-depth analysis detailing your home's value as well as a comparison with similar homes in the area
Home Values in the Area
Average Home Value in this Area
Purchase History
| Date | Buyer | Sale Price | Title Company |
|---|---|---|---|
| Morrison Kia | $253,000 | Vantage Land Title | |
| Lombardelli Michael E | -- | None Available | |
| Bailey Michael E | -- | -- | |
| Bailey Michael E | $143,200 | -- |
Source: Public Records
Mortgage History
| Date | Status | Borrower | Loan Amount |
|---|---|---|---|
| Previous Owner | Morrison Kia | $248,417 | |
| Previous Owner | Bailey Michael E | $140,893 |
Source: Public Records
Tax History Compared to Growth
Tax History
| Year | Tax Paid | Tax Assessment Tax Assessment Total Assessment is a certain percentage of the fair market value that is determined by local assessors to be the total taxable value of land and additions on the property. | Land | Improvement |
|---|---|---|---|---|
| 2024 | $3,905 | $91,270 | $19,240 | $72,030 |
| 2023 | $3,905 | $91,270 | $19,240 | $72,030 |
| 2022 | $3,457 | $68,900 | $12,820 | $56,080 |
| 2021 | $3,387 | $68,330 | $12,820 | $55,510 |
| 2020 | $3,242 | $68,330 | $12,820 | $55,510 |
| 2019 | $2,636 | $52,300 | $9,530 | $42,770 |
| 2018 | $2,646 | $52,300 | $9,530 | $42,770 |
| 2017 | $2,568 | $52,300 | $9,530 | $42,770 |
| 2016 | $2,583 | $50,130 | $9,530 | $40,600 |
| 2015 | $2,591 | $50,130 | $9,530 | $40,600 |
| 2014 | $2,478 | $50,130 | $9,530 | $40,600 |
Source: Public Records
Map
Nearby Homes
- 2540 Cornwall Dr
- 0 Berkshire Dr Unit 942854
- 2784 Greystoke Dr
- 2540 Jenny Marie Dr
- 2421 Louisiana Dr
- 2821 Raxit Ct
- 2499 Jenny Marie Dr
- 1318 Prem Place
- 2345 Tennessee Dr
- 2705 Tennessee Dr
- 1304 Baybury Ave
- 1248 Prem Place
- 1298 Baybury Ave
- 1107 Arkansas Dr
- 1282 Baybury Ave
- 2144 Tandem Dr
- 1255 Colorado Dr
- 1213 Prem Place
- 2692 Kingman Dr
- 1293 Baybury Ave
- 2649 Greystoke Ct
- 2669 Greystoke Ct
- 2641 Greystoke Ct
- 2660 Greystoke Ct
- 2652 Greystoke Ct
- 2633 Greystoke Ct
- 2644 Greystoke Ct
- 2668 Greystoke Ct
- 2701 Greystoke Dr
- 2636 Greystoke Ct
- 2625 Greystoke Ct
- 0 Lower Bellbrook Rd
- 2628 Greystoke Ct
- 1426 Sterling Commons Blvd
- 2707 Greystoke Dr
- 2661 Ketki Ct
- 2653 Ketki Ct
- 2669 Ketki Ct
- 2645 Ketki Ct
- 2637 Ketki Ct