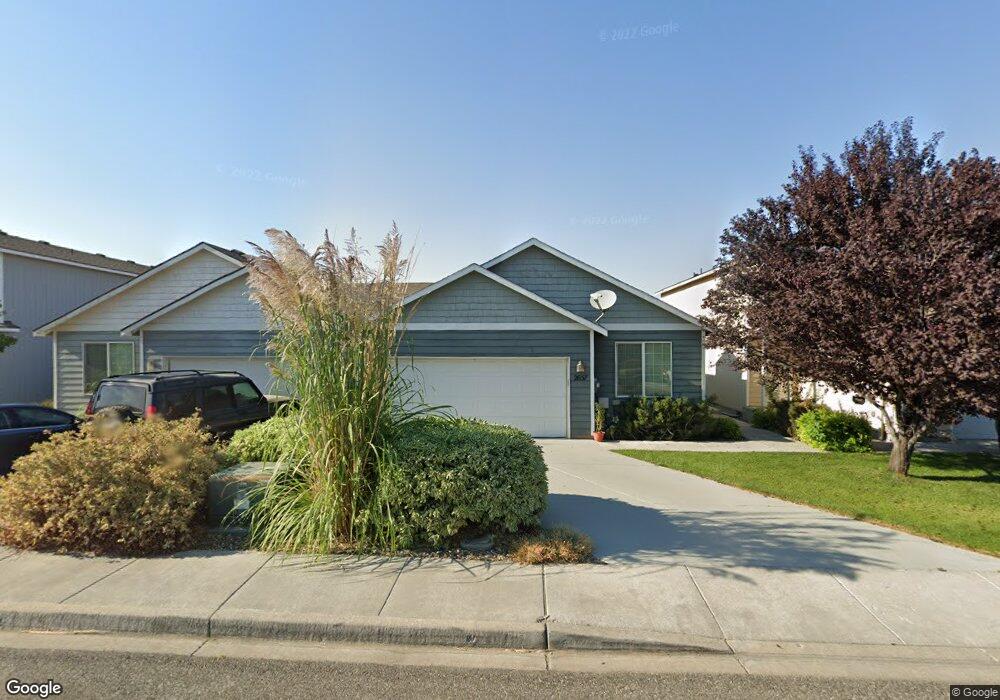
2657 Jason Loop Richland, WA 99352
Estimated Value: $292,000 - $337,000
2
Beds
2
Baths
1,233
Sq Ft
$261/Sq Ft
Est. Value
About This Home
This home is located at 2657 Jason Loop, Richland, WA 99352 and is currently estimated at $322,109, approximately $261 per square foot. 2657 Jason Loop is a home located in Benton County with nearby schools including White Bluffs Elementary School, Enterprise Middle School, and Richland High School.
Ownership History
Date
Name
Owned For
Owner Type
Purchase Details
Closed on
Jan 26, 2011
Sold by
Brown Roy B
Bought by
Brown Leslie Ann
Current Estimated Value
Home Financials for this Owner
Home Financials are based on the most recent Mortgage that was taken out on this home.
Original Mortgage
$107,992
Outstanding Balance
$72,673
Interest Rate
4.82%
Mortgage Type
New Conventional
Estimated Equity
$249,436
Purchase Details
Closed on
May 21, 2008
Sold by
Sound Built Townhomes Llc
Bought by
Cascade Premium Rentals Llc
Home Financials for this Owner
Home Financials are based on the most recent Mortgage that was taken out on this home.
Original Mortgage
$386,000
Interest Rate
5.87%
Mortgage Type
Purchase Money Mortgage
Create a Home Valuation Report for This Property
The Home Valuation Report is an in-depth analysis detailing your home's value as well as a comparison with similar homes in the area
Home Values in the Area
Average Home Value in this Area
Purchase History
| Date | Buyer | Sale Price | Title Company |
|---|---|---|---|
| Brown Leslie Ann | -- | Cascade Title | |
| Brown Leslie Ann | $134,990 | Cascade Title | |
| Cascade Premium Rentals Llc | -- | Cascade Title |
Source: Public Records
Mortgage History
| Date | Status | Borrower | Loan Amount |
|---|---|---|---|
| Open | Brown Leslie Ann | $107,992 | |
| Previous Owner | Cascade Premium Rentals Llc | $386,000 |
Source: Public Records
Tax History
| Year | Tax Paid | Tax Assessment Tax Assessment Total Assessment is a certain percentage of the fair market value that is determined by local assessors to be the total taxable value of land and additions on the property. | Land | Improvement |
|---|---|---|---|---|
| 2025 | $2,628 | $290,900 | $80,000 | $210,900 |
| 2024 | $2,641 | $281,160 | $40,000 | $241,160 |
| 2023 | $2,641 | $281,160 | $40,000 | $241,160 |
| 2022 | $2,307 | $227,570 | $40,000 | $187,570 |
| 2021 | $2,173 | $207,480 | $40,000 | $167,480 |
| 2020 | $2,133 | $187,380 | $40,000 | $147,380 |
| 2019 | $1,581 | $173,980 | $40,000 | $133,980 |
| 2018 | $1,629 | $138,130 | $24,500 | $113,630 |
| 2017 | $1,432 | $119,190 | $24,500 | $94,690 |
| 2016 | $1,412 | $119,190 | $24,500 | $94,690 |
| 2015 | $1,439 | $119,190 | $24,500 | $94,690 |
| 2014 | -- | $119,190 | $24,500 | $94,690 |
| 2013 | -- | $119,190 | $24,500 | $94,690 |
Source: Public Records
Map
Nearby Homes
- 1128 Country Ridge Dr
- 1146 Country Ridge Dr
- 3680 Keene Rd - Lots 1 2 & 3 Unit 1,2&3
- 3381 Nottingham Dr
- 2356 Lariat Ln
- 2820 Appaloosa Way
- 1000 Nka Queensgate
- 875 Tulip Ln
- 0 Windmill Rd
- 3493 Hanstead St
- 1222 Country Ridge Dr
- 691 Windmill Rd
- 175 Bitterroot Dr
- 4228 Cowlitz Blvd
- 4272 Cowlitz Blvd Unit View
- 4443 Cowlitz Blvd
- 212 Crestwood Dr
- 1176 Lapins Ct
- 131 Windhaven Ln
- 681 Lonetree Ln
- 2661 Jason Loop
- 2653 Jason Loop
- 2665 Jason Loop
- 2649 Jason Loop
- 2645 Jason Loop
- 2669 Jason Loop
- 2641 Jason Loop
- 2673 Jason Loop
- 2662 Jason Loop
- 2666 Jason Loop
- 2658 Jason Loop
- 2670 Jason Loop
- 2654 Jason Loop
- 2677 Jason Loop
- 2637 Jason Loop
- 2650 Jason Loop
- 2674 Jason Loop
- 2681 Jason Loop
- 2646 Jason Loop
- 2633 Jason Loop
Your Personal Tour Guide
Ask me questions while you tour the home.