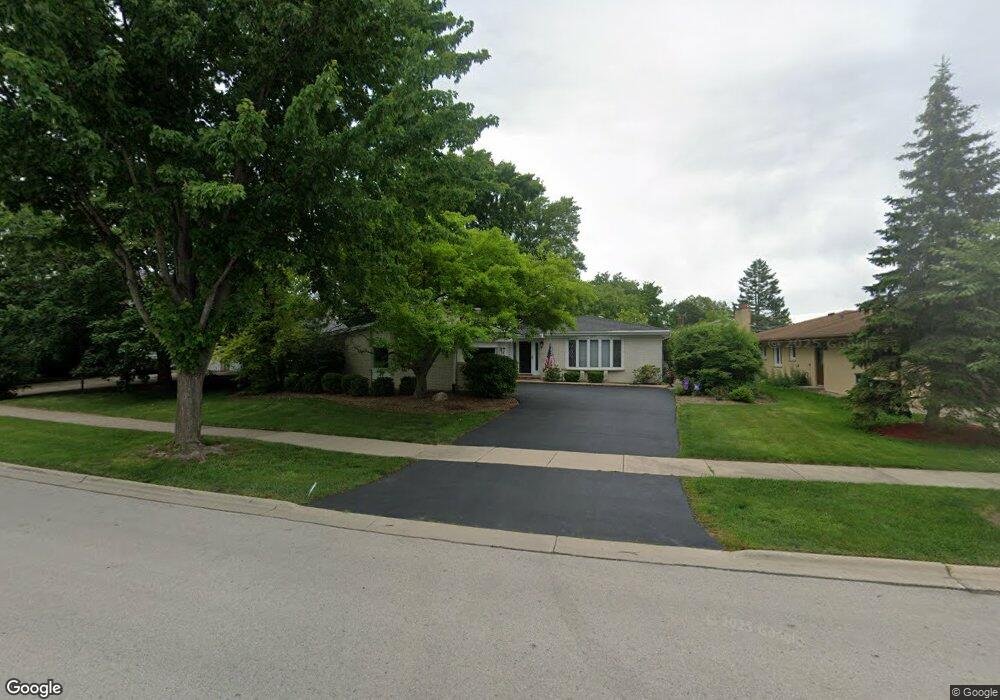
2657 N Bradford Dr Unit 1 Arlington Heights, IL 60004
Estimated Value: $492,000 - $520,000
3
Beds
3
Baths
1,416
Sq Ft
$356/Sq Ft
Est. Value
About This Home
This home is located at 2657 N Bradford Dr Unit 1, Arlington Heights, IL 60004 and is currently estimated at $503,923, approximately $355 per square foot. 2657 N Bradford Dr Unit 1 is a home located in Cook County with nearby schools including Ivy Hill Elementary School, Thomas Middle School, and Buffalo Grove High School.
Ownership History
Date
Name
Owned For
Owner Type
Purchase Details
Closed on
Aug 15, 2016
Sold by
Bentz Gina L
Bought by
Bentz Gina L
Current Estimated Value
Home Financials for this Owner
Home Financials are based on the most recent Mortgage that was taken out on this home.
Original Mortgage
$289,733
Outstanding Balance
$239,294
Interest Rate
4.62%
Mortgage Type
FHA
Estimated Equity
$264,629
Purchase Details
Closed on
Jul 20, 2011
Sold by
Bentz Gregory G
Bought by
Bentz Gina L
Home Financials for this Owner
Home Financials are based on the most recent Mortgage that was taken out on this home.
Original Mortgage
$293,000
Interest Rate
3.9%
Mortgage Type
New Conventional
Purchase Details
Closed on
Jul 17, 1998
Sold by
Larkin Stephen J and Lee Cheryl
Bought by
Bentz Gregory G and Bentz Gina L
Home Financials for this Owner
Home Financials are based on the most recent Mortgage that was taken out on this home.
Original Mortgage
$166,500
Interest Rate
7.15%
Purchase Details
Closed on
May 1, 1994
Sold by
Hornback Vernon T and Hornback Alice P
Bought by
Larkin Stephen J and Lee Cheryl
Home Financials for this Owner
Home Financials are based on the most recent Mortgage that was taken out on this home.
Original Mortgage
$140,000
Interest Rate
8.58%
Create a Home Valuation Report for This Property
The Home Valuation Report is an in-depth analysis detailing your home's value as well as a comparison with similar homes in the area
Home Values in the Area
Average Home Value in this Area
Purchase History
| Date | Buyer | Sale Price | Title Company |
|---|---|---|---|
| Bentz Gina L | -- | None Available | |
| Bentz Gina L | -- | None Available | |
| Bentz Gregory G | $222,000 | -- | |
| Larkin Stephen J | $230,000 | Land Title American |
Source: Public Records
Mortgage History
| Date | Status | Borrower | Loan Amount |
|---|---|---|---|
| Open | Bentz Gina L | $289,733 | |
| Closed | Bentz Gina L | $293,000 | |
| Closed | Bentz Gregory G | $166,500 | |
| Previous Owner | Larkin Stephen J | $140,000 |
Source: Public Records
Tax History Compared to Growth
Tax History
| Year | Tax Paid | Tax Assessment Tax Assessment Total Assessment is a certain percentage of the fair market value that is determined by local assessors to be the total taxable value of land and additions on the property. | Land | Improvement |
|---|---|---|---|---|
| 2024 | $9,769 | $39,000 | $11,132 | $27,868 |
| 2023 | $9,381 | $39,000 | $11,132 | $27,868 |
| 2022 | $9,381 | $39,000 | $11,132 | $27,868 |
| 2021 | $8,766 | $32,452 | $6,325 | $26,127 |
| 2020 | $8,606 | $32,452 | $6,325 | $26,127 |
| 2019 | $8,599 | $36,179 | $6,325 | $29,854 |
| 2018 | $9,034 | $34,392 | $5,566 | $28,826 |
| 2017 | $8,945 | $34,392 | $5,566 | $28,826 |
| 2016 | $8,579 | $34,392 | $5,566 | $28,826 |
| 2015 | $8,198 | $30,388 | $4,807 | $25,581 |
| 2014 | $7,974 | $30,388 | $4,807 | $25,581 |
| 2013 | $7,757 | $30,388 | $4,807 | $25,581 |
Source: Public Records
Map
Nearby Homes
- 2620 N Windsor Dr Unit 201
- 504 E Sunset Dr
- 2604 N Windsor Dr Unit 206
- 2640 N Windsor Dr Unit 102
- 2632 N Windsor Dr Unit 104
- 2315 N Arlington Heights Rd
- 1306 E Best Dr
- 2608 N Wilshire Ln
- 2522 N Chestnut Ave
- 215 W Hintz Rd
- 3157 N Daniels Ct Unit 1502
- 2100 N Ridge Rd
- 1225 Radcliffe Rd Unit 2
- 2624 N Prindle Ave
- 2616 N Prindle Ave
- 1127 Miller Ln Unit 107
- 972 Thornton Ln Unit 102
- 3222 N Heritage Ln
- 3300 N Carriageway Dr Unit 317
- 1115 Miller Ln Unit 104
- 2661 N Bradford Dr
- 714 E Canterbury Dr
- 711 E Hintz Rd
- 2665 N Bradford Dr
- 715 E Hintz Rd
- 720 E Canterbury Dr
- 719 E Hintz Rd
- 2631 N Bradford Dr
- 726 E Canterbury Dr
- 719 E Canterbury Dr
- 730 E Canterbury Dr Unit 1
- 2627 N Bradford Dr
- 2649 N Douglas Ave
- 2645 N Douglas Ave
- 2592 N Hickory Ln
- 2655 N Douglas Ave
- 704 E Hintz Rd
- 729 E Hintz Rd
- 2641 N Douglas Ave
- 727 E Canterbury Dr