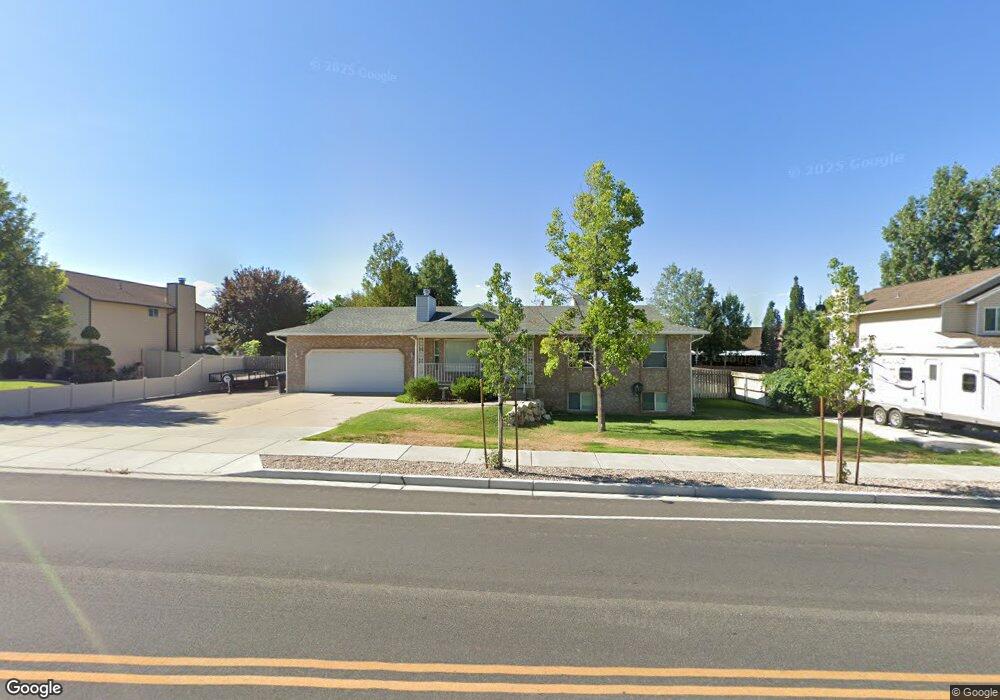
2657 W 800 N Clearfield, UT 84015
Estimated Value: $475,000 - $512,000
4
Beds
2
Baths
2,458
Sq Ft
$203/Sq Ft
Est. Value
About This Home
This home is located at 2657 W 800 N, Clearfield, UT 84015 and is currently estimated at $498,045, approximately $202 per square foot. 2657 W 800 N is a home located in Davis County with nearby schools including Lakeside School, West Point Junior High School, and Syracuse High School.
Ownership History
Date
Name
Owned For
Owner Type
Purchase Details
Closed on
May 13, 2021
Sold by
Soto Nicolas E
Bought by
Musters Adrian
Current Estimated Value
Home Financials for this Owner
Home Financials are based on the most recent Mortgage that was taken out on this home.
Original Mortgage
$311,000
Outstanding Balance
$281,244
Interest Rate
3.1%
Mortgage Type
New Conventional
Estimated Equity
$216,801
Purchase Details
Closed on
Apr 27, 2021
Sold by
Soto Michael N
Bought by
Soto Nicolas E
Home Financials for this Owner
Home Financials are based on the most recent Mortgage that was taken out on this home.
Original Mortgage
$311,000
Outstanding Balance
$281,244
Interest Rate
3.1%
Mortgage Type
New Conventional
Estimated Equity
$216,801
Purchase Details
Closed on
Jun 29, 2016
Sold by
Soto Nicolas E
Bought by
Soto Nicolas E and Soto Michael N
Create a Home Valuation Report for This Property
The Home Valuation Report is an in-depth analysis detailing your home's value as well as a comparison with similar homes in the area
Home Values in the Area
Average Home Value in this Area
Purchase History
| Date | Buyer | Sale Price | Title Company |
|---|---|---|---|
| Musters Adrian | -- | Meridian Title Com | |
| Soto Nicolas E | -- | Meridian Title Compan | |
| Soto Nicolas E | -- | Old Republic Title |
Source: Public Records
Mortgage History
| Date | Status | Borrower | Loan Amount |
|---|---|---|---|
| Open | Musters Adrian | $311,000 |
Source: Public Records
Tax History Compared to Growth
Tax History
| Year | Tax Paid | Tax Assessment Tax Assessment Total Assessment is a certain percentage of the fair market value that is determined by local assessors to be the total taxable value of land and additions on the property. | Land | Improvement |
|---|---|---|---|---|
| 2025 | $2,706 | $253,550 | $106,735 | $146,815 |
| 2024 | $2,589 | $243,651 | $96,124 | $147,527 |
| 2023 | $2,402 | $416,000 | $117,965 | $298,035 |
| 2022 | $2,588 | $245,300 | $60,851 | $184,449 |
| 2021 | $2,215 | $314,000 | $97,067 | $216,933 |
| 2020 | $1,569 | $272,000 | $81,179 | $190,821 |
| 2019 | $1,569 | $258,000 | $78,868 | $179,132 |
| 2018 | $0 | $233,000 | $79,677 | $153,323 |
| 2016 | $1,490 | $106,590 | $30,793 | $75,797 |
| 2015 | $1,459 | $98,945 | $30,793 | $68,152 |
| 2014 | $1,409 | $96,887 | $30,793 | $66,094 |
| 2013 | $1,227 | $80,087 | $30,690 | $49,397 |
Source: Public Records
Map
Nearby Homes