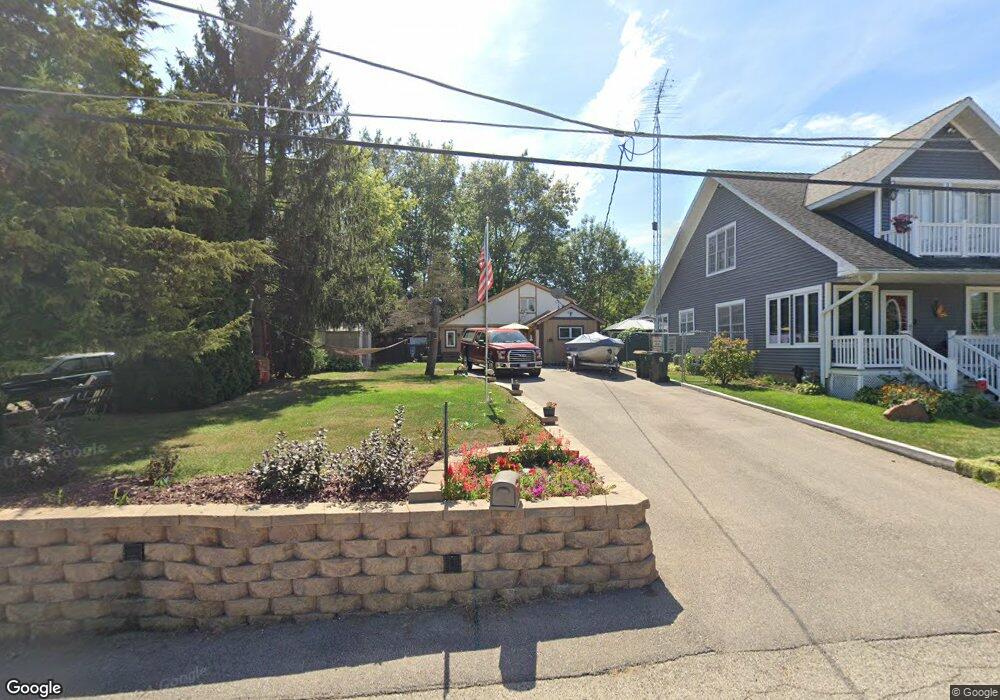
26573 W Maple St Antioch, IL 60002
Channel Lake NeighborhoodEstimated Value: $151,000 - $225,000
2
Beds
1
Bath
1,190
Sq Ft
$170/Sq Ft
Est. Value
About This Home
This home is located at 26573 W Maple St, Antioch, IL 60002 and is currently estimated at $202,657, approximately $170 per square foot. 26573 W Maple St is a home located in Lake County with nearby schools including Antioch Community High School.
Ownership History
Date
Name
Owned For
Owner Type
Purchase Details
Closed on
Dec 30, 2016
Sold by
Szudarski Roger
Bought by
Szudarski Keith
Current Estimated Value
Purchase Details
Closed on
Aug 12, 1996
Sold by
Barr Bradford A and Barra Laura A
Bought by
Szudarski Kathleen M
Home Financials for this Owner
Home Financials are based on the most recent Mortgage that was taken out on this home.
Original Mortgage
$66,750
Outstanding Balance
$5,399
Interest Rate
8.47%
Estimated Equity
$197,258
Purchase Details
Closed on
Sep 28, 1993
Sold by
Lasalle National Trust Na
Bought by
Barr Bradford A and Barr Laura A
Home Financials for this Owner
Home Financials are based on the most recent Mortgage that was taken out on this home.
Original Mortgage
$75,600
Interest Rate
7.15%
Create a Home Valuation Report for This Property
The Home Valuation Report is an in-depth analysis detailing your home's value as well as a comparison with similar homes in the area
Home Values in the Area
Average Home Value in this Area
Purchase History
| Date | Buyer | Sale Price | Title Company |
|---|---|---|---|
| Szudarski Keith | $40,000 | Attorney | |
| Szudarski Kathleen M | $89,000 | Attorneys Natl Title Network | |
| Barr Bradford A | $56,000 | Chicago Title Insurance Co |
Source: Public Records
Mortgage History
| Date | Status | Borrower | Loan Amount |
|---|---|---|---|
| Open | Szudarski Kathleen M | $66,750 | |
| Previous Owner | Barr Bradford A | $75,600 |
Source: Public Records
Tax History Compared to Growth
Tax History
| Year | Tax Paid | Tax Assessment Tax Assessment Total Assessment is a certain percentage of the fair market value that is determined by local assessors to be the total taxable value of land and additions on the property. | Land | Improvement |
|---|---|---|---|---|
| 2024 | $3,499 | $47,705 | $2,966 | $44,739 |
| 2023 | $3,384 | $42,716 | $2,656 | $40,060 |
| 2022 | $3,384 | $38,930 | $4,451 | $34,479 |
| 2021 | $3,107 | $36,325 | $4,153 | $32,172 |
| 2020 | $3,031 | $35,322 | $4,038 | $31,284 |
| 2019 | $3,077 | $33,779 | $3,862 | $29,917 |
| 2018 | $2,925 | $33,144 | $2,792 | $30,352 |
| 2017 | $2,889 | $31,548 | $2,658 | $28,890 |
| 2016 | $3,489 | $30,446 | $2,565 | $27,881 |
| 2015 | $2,538 | $29,672 | $2,500 | $27,172 |
| 2014 | $1,131 | $33,440 | $3,730 | $29,710 |
| 2012 | $2,961 | $35,004 | $3,730 | $31,274 |
Source: Public Records
Map
Nearby Homes
- 42362 N Poplar St
- 42432 N Lake Ave
- 42310 N Woodbine Ave
- 42517 N Poplar St
- 26347 W Shannon Ave
- 26211 W Spring Grove Rd
- 26427 W Prospect Ave
- 42460 N Pedersen Ln
- 42138 N Lotus Ave
- 26299 W Forest Ct
- 26048 W Forest Ave
- 42489 N Forest Ln
- 42425 N Park Ln
- 42479 N Forest Ln
- 25174 W Claridan Ave
- 27490 W Wilmot Rd
- 1137 Oak Point Ct
- 25076 W Edgar Ave
- 43247 N Grandview Terrace
- 25118 W Catherine Ave
- 26567 W Maple St
- 26581 W Maple St
- 26557 W Maple St
- 26597 W Maple St
- 26541 W Maple St
- 26580 W Maple St
- 42277 N Chestnut St
- 26590 W Maple St
- 42230 N Lake Ave
- 26607 W Maple St
- 42223 N Chase Ct
- 42301 N Chestnut St
- 26610 W Maple St
- 26619 W Maple St
- 42311 N Chestnut St
- 42222 N Chase Ct
- 26623 W Maple St
- 42316 N Willow St
- 42326 N Willow St
- 42088 N Lake Ave