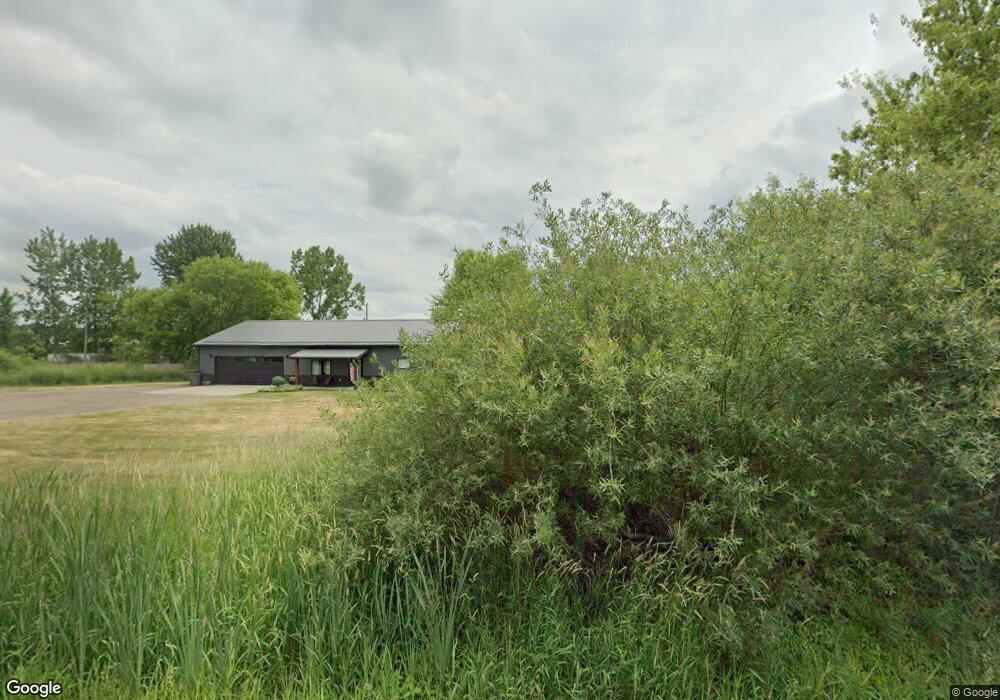
2658 108th St SW Byron Center, MI 49315
Estimated Value: $463,995 - $557,000
2
Beds
1
Bath
1
Sq Ft
$501,499/Sq Ft
Est. Value
About This Home
This home is located at 2658 108th St SW, Byron Center, MI 49315 and is currently estimated at $501,499, approximately $501,499 per square foot. 2658 108th St SW is a home located in Allegan County with nearby schools including Wayland High School, Byron Center Charter School, and Zion Christian School.
Ownership History
Date
Name
Owned For
Owner Type
Purchase Details
Closed on
Nov 9, 2018
Sold by
Holcomb Michael
Bought by
Nielsen Justin
Current Estimated Value
Home Financials for this Owner
Home Financials are based on the most recent Mortgage that was taken out on this home.
Original Mortgage
$34,500
Outstanding Balance
$30,336
Interest Rate
4.8%
Mortgage Type
New Conventional
Estimated Equity
$471,163
Purchase Details
Closed on
Jan 25, 2018
Sold by
Holcomb Michael
Bought by
Nielsen Justin
Purchase Details
Closed on
May 18, 2000
Bought by
Holcomb Michael
Purchase Details
Closed on
May 16, 2000
Bought by
Bank United
Purchase Details
Closed on
May 5, 2000
Bought by
Holcomb Michael
Purchase Details
Closed on
Dec 30, 1999
Bought by
Department Of Veterans Affairs
Purchase Details
Closed on
Nov 18, 1999
Sold by
Scharf Richard and Scharf Jannell
Bought by
Bank United
Purchase Details
Closed on
Jan 30, 1996
Sold by
Scharf Richard and Scharf Jannell
Purchase Details
Closed on
Feb 16, 1994
Bought by
Steven"
Create a Home Valuation Report for This Property
The Home Valuation Report is an in-depth analysis detailing your home's value as well as a comparison with similar homes in the area
Home Values in the Area
Average Home Value in this Area
Purchase History
| Date | Buyer | Sale Price | Title Company |
|---|---|---|---|
| Nielsen Justin | $45,000 | None Available | |
| Nielsen Justin | -- | None Available | |
| Holcomb Michael | $17,000 | -- | |
| Bank United | -- | -- | |
| Holcomb Michael | $17,000 | -- | |
| Department Of Veterans Affairs | -- | -- | |
| Bank United | -- | -- | |
| -- | $68,000 | -- | |
| Steven" | $56,000 | -- |
Source: Public Records
Mortgage History
| Date | Status | Borrower | Loan Amount |
|---|---|---|---|
| Open | Nielsen Justin | $34,500 | |
| Closed | Nielsen Justin | $0 |
Source: Public Records
Tax History Compared to Growth
Tax History
| Year | Tax Paid | Tax Assessment Tax Assessment Total Assessment is a certain percentage of the fair market value that is determined by local assessors to be the total taxable value of land and additions on the property. | Land | Improvement |
|---|---|---|---|---|
| 2025 | $4,573 | $214,400 | $53,900 | $160,500 |
| 2024 | $4,127 | $194,300 | $41,900 | $152,400 |
| 2023 | $4,229 | $177,300 | $40,600 | $136,700 |
| 2022 | $4,127 | $147,200 | $30,900 | $116,300 |
| 2021 | $3,860 | $137,600 | $26,600 | $111,000 |
| 2020 | $4,329 | $123,200 | $25,400 | $97,800 |
| 2019 | $4,329 | $142,700 | $18,700 | $124,000 |
| 2018 | $802 | $18,700 | $18,700 | $0 |
| 2017 | $0 | $16,700 | $16,700 | $0 |
| 2016 | $0 | $17,800 | $17,800 | $0 |
| 2015 | -- | $17,800 | $17,800 | $0 |
| 2014 | -- | $17,800 | $0 | $0 |
| 2013 | -- | $16,000 | $16,000 | $0 |
Source: Public Records
Map
Nearby Homes
- 10591 Byron Center Ave SW
- 136 100th St SW
- 737 100th St SW
- V/L Ivanrest Ave SW
- 10780 Windward Ave SW
- 9705 Byron Center Ave SW
- 10785 Windward Ave SW
- 10711 Windward Ave SW
- 10725 Windward Ave SW
- 1069 108th St SW
- 9277 Ivanrest Ave SW
- 1722 144th Ave
- 3370 92nd St SW
- 3410 92nd St SW
- 2156 Center Grange Dr
- 1941 Conifer Ridge Dr SW
- 2599 Ridge Top Dr SW
- 1861 Restoration Dr SW
- 8750 Lindsey Ln SW Unit 23
- 2267 Aimie Ave SW
- 2658 Ottogan Ave
- 1884 108th St SW
- 1840 Ottogan Ave SW
- 4296 108th St SW
- 0 108th St SW
- 1850 108th St SW
- 1925 108th St SW
- 1900 108th St SW
- 4296 108th St SW
- 2643 108th St SW
- 4647 108th St SW
- 0 108th St SW Unit APP 3 3422738
- 3701 108th St SW
- 0 108th St SW Unit APP 4 3215608
- 0 108th St SW Unit APP 2 3211498
- 0 108th St SW Unit Parce 3184540
- 0 108th St SW Unit Parce 3184538
- 0 108th St SW Unit Parce 3184537
- 0 108th St SW Unit Parce 3184543
- 0 108th St SW Unit Parce 3184454