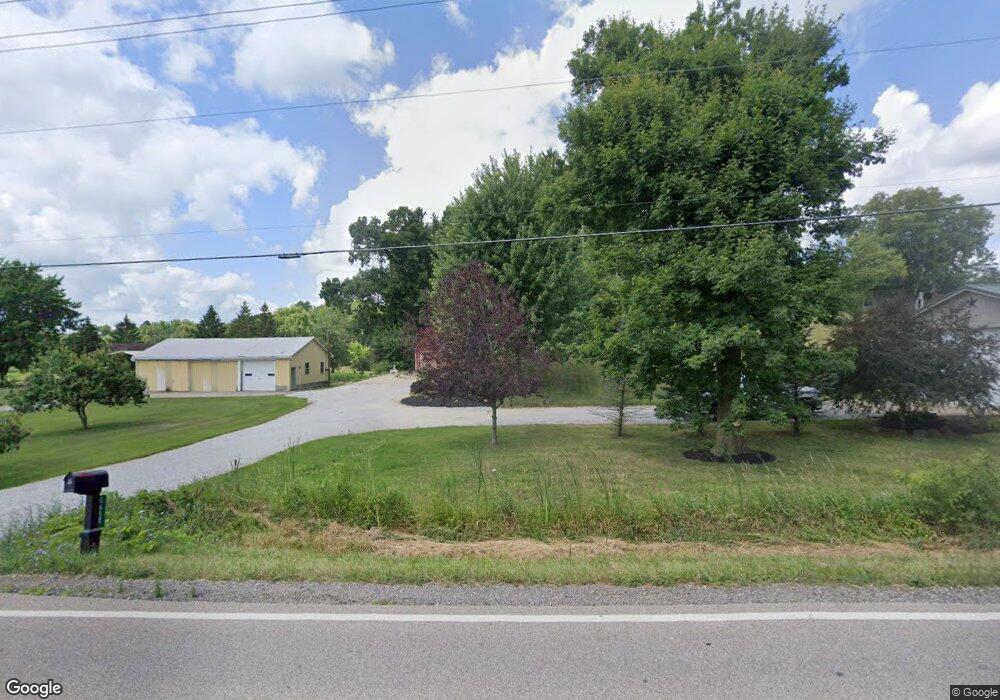
2658 Marks Rd Valley City, OH 44280
Estimated Value: $247,000 - $281,000
3
Beds
2
Baths
1,350
Sq Ft
$197/Sq Ft
Est. Value
About This Home
This home is located at 2658 Marks Rd, Valley City, OH 44280 and is currently estimated at $266,616, approximately $197 per square foot. 2658 Marks Rd is a home located in Medina County with nearby schools including Buckeye Intermediate School, Buckeye Primary School, and Buckeye Junior High School.
Ownership History
Date
Name
Owned For
Owner Type
Purchase Details
Closed on
Sep 30, 2016
Sold by
Frambach Carol
Bought by
Ulmer Lisa A
Current Estimated Value
Home Financials for this Owner
Home Financials are based on the most recent Mortgage that was taken out on this home.
Original Mortgage
$191,250
Outstanding Balance
$153,177
Interest Rate
3.43%
Mortgage Type
Future Advance Clause Open End Mortgage
Estimated Equity
$113,439
Purchase Details
Closed on
May 22, 2012
Sold by
Mulcahy James M and Mulcahy Marilyn L
Bought by
Mulcahy Marilyn L
Purchase Details
Closed on
Aug 31, 2007
Sold by
Mckim William and Mckim William Leon
Bought by
Mulcahy James M
Home Financials for this Owner
Home Financials are based on the most recent Mortgage that was taken out on this home.
Original Mortgage
$56,000
Interest Rate
6.71%
Mortgage Type
Future Advance Clause Open End Mortgage
Purchase Details
Closed on
Jul 7, 1997
Sold by
Estate Of Phoebe A Mckim
Bought by
Mckim William and Mckim William Leon
Create a Home Valuation Report for This Property
The Home Valuation Report is an in-depth analysis detailing your home's value as well as a comparison with similar homes in the area
Home Values in the Area
Average Home Value in this Area
Purchase History
| Date | Buyer | Sale Price | Title Company |
|---|---|---|---|
| Ulmer Lisa A | $225,000 | None Available | |
| Mulcahy Marilyn L | -- | -- | |
| Mulcahy James M | $70,000 | -- | |
| Mckim William | -- | -- |
Source: Public Records
Mortgage History
| Date | Status | Borrower | Loan Amount |
|---|---|---|---|
| Open | Ulmer Lisa A | $191,250 | |
| Previous Owner | Mulcahy James M | $56,000 |
Source: Public Records
Tax History Compared to Growth
Tax History
| Year | Tax Paid | Tax Assessment Tax Assessment Total Assessment is a certain percentage of the fair market value that is determined by local assessors to be the total taxable value of land and additions on the property. | Land | Improvement |
|---|---|---|---|---|
| 2024 | $1,881 | $50,660 | $19,740 | $30,920 |
| 2023 | $1,887 | $50,660 | $19,740 | $30,920 |
| 2022 | $1,908 | $50,660 | $19,740 | $30,920 |
| 2021 | $1,631 | $39,580 | $15,420 | $24,160 |
| 2020 | $1,639 | $39,580 | $15,420 | $24,160 |
| 2019 | $1,745 | $39,580 | $15,420 | $24,160 |
| 2018 | $1,552 | $33,730 | $13,430 | $20,300 |
| 2017 | $1,550 | $33,730 | $13,430 | $20,300 |
| 2016 | $1,599 | $33,730 | $13,430 | $20,300 |
| 2015 | $1,534 | $31,240 | $12,440 | $18,800 |
| 2014 | $1,134 | $31,240 | $12,440 | $18,800 |
| 2013 | $1,129 | $31,240 | $12,440 | $18,800 |
Source: Public Records
Map
Nearby Homes
- 3135 Crooked Creek Cir
- 5395 Sleepy Hollow Rd Lot #12
- 5411 Sleepy Hollow Rd Lot #11
- 5427 Sleepy Hollow Rd Lot #10
- 5445 Sleepy Hollow Rd Lot #9
- 5457 Sleepy Hollow Rd Lot #8
- 5519 Sleepy Hollow Rd Lot #4
- 2483 Substation Rd
- 4538 Kingsbury Rd
- 5446 Royal Brook Dr
- 5531 Winter Brook Dr
- VL Laurel & Substation Rd
- 0 E Law Rd
- 3722 Watkins Rd
- 6154 Spieth Rd
- 6162 Spieth Rd
- 6216 Spieth Rd
- 6530 Logans Run
- 4464 Newcastle Cove
- 6273 E Law Rd