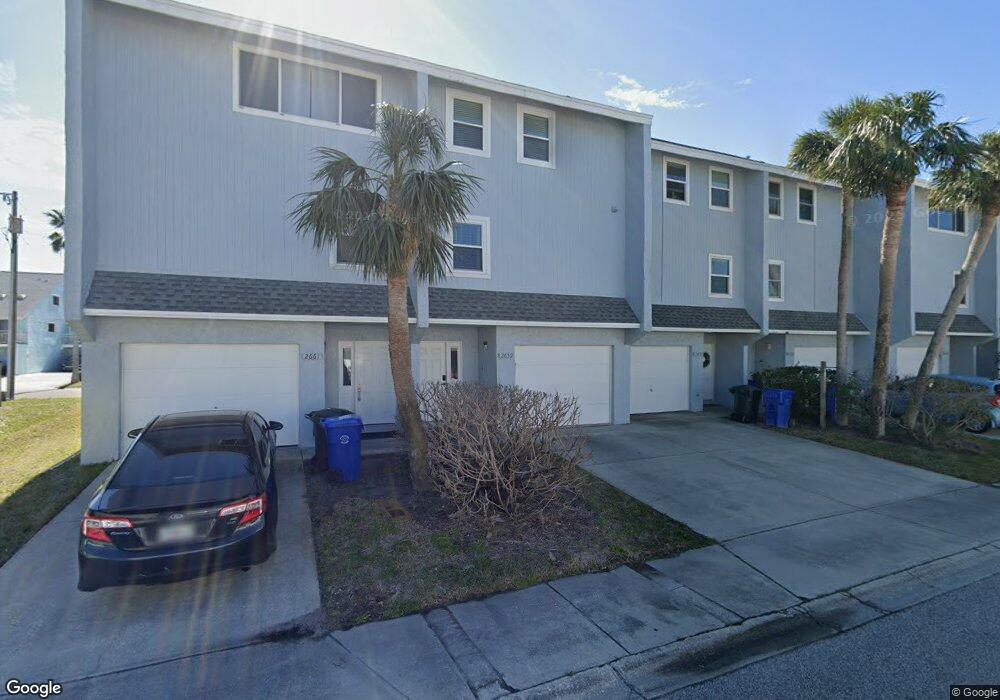
2659 St Joseph Dr Unit 108 Dunedin, FL 34698
Estimated Value: $377,000 - $462,000
--
Bed
2
Baths
1,211
Sq Ft
$338/Sq Ft
Est. Value
About This Home
This home is located at 2659 St Joseph Dr Unit 108, Dunedin, FL 34698 and is currently estimated at $408,768, approximately $337 per square foot. 2659 St Joseph Dr Unit 108 is a home located in Pinellas County with nearby schools including San Jose Elementary School, Palm Harbor Middle School, and Dunedin High School.
Ownership History
Date
Name
Owned For
Owner Type
Purchase Details
Closed on
Jan 3, 2022
Sold by
Webber Jacquelyn
Bought by
Freeman Charles E Hillman and Geiling Ellen T
Current Estimated Value
Home Financials for this Owner
Home Financials are based on the most recent Mortgage that was taken out on this home.
Original Mortgage
$279,750
Outstanding Balance
$257,297
Interest Rate
3.11%
Mortgage Type
New Conventional
Estimated Equity
$151,471
Purchase Details
Closed on
Feb 28, 2018
Sold by
Munger Cynthia and Munger David
Bought by
Webber Jacquelyn
Purchase Details
Closed on
Mar 21, 2016
Sold by
Irvin Jeff A and Irvin Dena
Bought by
Munger Cynthia and Munger David
Purchase Details
Closed on
Mar 15, 2004
Sold by
Ioannou Peter and Ioannou Afroulla
Bought by
Irvin Jeff A and Irvin Dena A
Create a Home Valuation Report for This Property
The Home Valuation Report is an in-depth analysis detailing your home's value as well as a comparison with similar homes in the area
Home Values in the Area
Average Home Value in this Area
Purchase History
| Date | Buyer | Sale Price | Title Company |
|---|---|---|---|
| Freeman Charles E Hillman | $373,000 | None Listed On Document | |
| Freeman Charles E Hillman | $373,000 | None Listed On Document | |
| Webber Jacquelyn | $210,000 | Sunbelt Title Agency | |
| Munger Cynthia | $158,000 | Capstone Title Llc | |
| Irvin Jeff A | $149,000 | Sunbelt Title Agency |
Source: Public Records
Mortgage History
| Date | Status | Borrower | Loan Amount |
|---|---|---|---|
| Open | Freeman Charles E Hillman | $279,750 | |
| Closed | Freeman Charles E Hillman | $279,750 |
Source: Public Records
Tax History Compared to Growth
Tax History
| Year | Tax Paid | Tax Assessment Tax Assessment Total Assessment is a certain percentage of the fair market value that is determined by local assessors to be the total taxable value of land and additions on the property. | Land | Improvement |
|---|---|---|---|---|
| 2024 | $6,060 | $354,148 | -- | $354,148 |
| 2023 | $6,060 | $345,791 | $0 | $345,791 |
| 2022 | $1,932 | $151,579 | $0 | $0 |
| 2021 | $1,947 | $147,164 | $0 | $0 |
| 2020 | $1,937 | $145,132 | $0 | $0 |
| 2019 | $3,211 | $169,555 | $0 | $169,555 |
| 2018 | $3,004 | $162,185 | $0 | $0 |
| 2017 | $2,727 | $140,598 | $0 | $0 |
| 2016 | $2,588 | $131,878 | $0 | $0 |
| 2015 | $2,677 | $133,353 | $0 | $0 |
| 2014 | $2,756 | $139,425 | $0 | $0 |
Source: Public Records
Map
Nearby Homes
- 2643 St Josephs Dr W
- 2685 Saint Joseph Dr
- 2630 St Josephs Dr W
- 210 Bunker Hill Ln
- 200 Woodette Dr Unit 102
- 20 Outlook Way Unit 10
- 20 Outlook Way Unit 7
- 2570 Gary Cir Unit 3
- 300 Woodette Dr Unit 202B
- 300 Woodette Dr Unit 203D
- 2530 Gary Cir Unit 903
- 340 Causeway Blvd Unit 105
- 340 Causeway Blvd Unit 104
- 340 Causeway Blvd Unit 112
- 2675 St Josephs Dr E Unit C
- 2600 Paula Dr N Unit 2B
- 433 Paula Dr S Unit 27
- 433 Paula Dr S Unit 31
- 464 N Paula Dr Unit 207
- 464 N Paula Dr Unit 301
- 2643 Saint Joseph Dr W
- 2659 Saint Joseph Dr W Unit 108
- 2635 Saint Joseph Dr W
- 2635 Saint Joseph Dr W Unit 2635
- 2635 Saint Joseph Dr W Unit 102
- 2659 St Josephs Dr W Unit 108
- 2647 St Josephs Dr W Unit 105
- 2639 Saint Joseph Dr W
- 2656 St Josephs Dr W
- 2651 Saint Joseph Dr W Unit 106
- 2658 St Josephs Dr W
- 2647 Saint Joseph Dr W Unit 105
- 2628 St Joseph Dr
- 2646 St Josephs Dr W
- 2646 Saint Joseph Dr W
- 2644 Saint Joseph Dr W
- 2642 Saint Joseph Dr W
- 2656 Saint Joseph Dr W
- 2670 Gary Cir Unit 3
- 2654 Saint Joseph Dr W