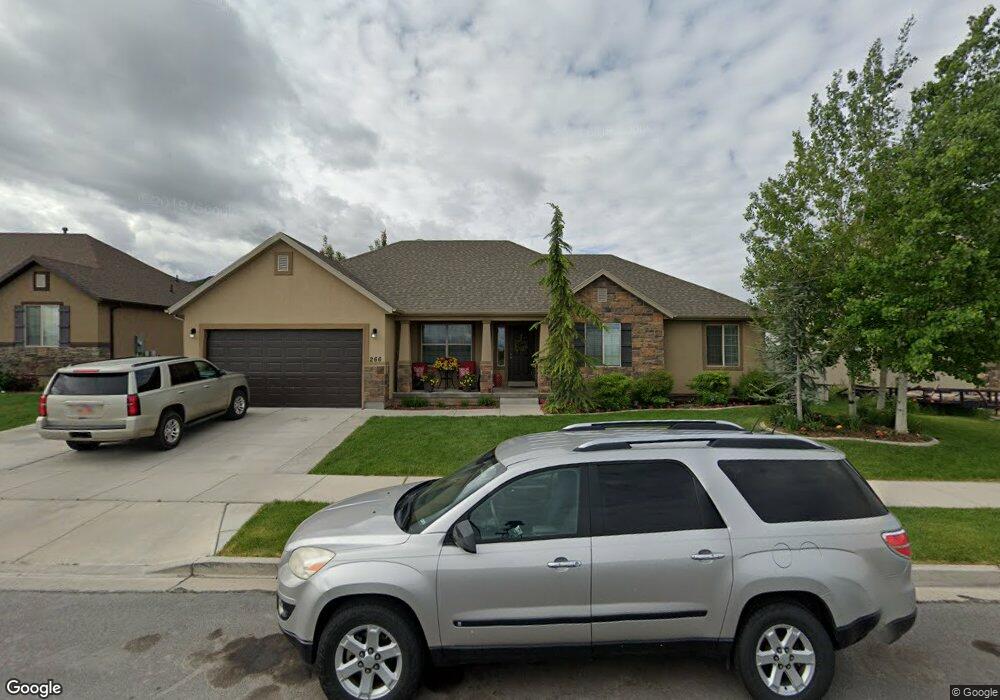
266 E 1100 S Payson, UT 84651
Estimated Value: $590,000 - $619,950
6
Beds
5
Baths
3,696
Sq Ft
$164/Sq Ft
Est. Value
About This Home
This home is located at 266 E 1100 S, Payson, UT 84651 and is currently estimated at $607,983, approximately $164 per square foot. 266 E 1100 S is a home located in Utah County with nearby schools including Park View Elementary, Payson High School, and Payson Junior High School.
Ownership History
Date
Name
Owned For
Owner Type
Purchase Details
Closed on
Apr 15, 2020
Sold by
Bingham Jathan K and Bingham Julie
Bought by
Carter Lindsey Marie and Carter Kc Shawn
Current Estimated Value
Home Financials for this Owner
Home Financials are based on the most recent Mortgage that was taken out on this home.
Original Mortgage
$407,384
Outstanding Balance
$356,656
Interest Rate
3.25%
Mortgage Type
FHA
Estimated Equity
$251,327
Purchase Details
Closed on
Jun 30, 2010
Sold by
Homes By Harmony Inc
Bought by
Bingham Jathan K and Bingham Julie
Home Financials for this Owner
Home Financials are based on the most recent Mortgage that was taken out on this home.
Original Mortgage
$227,979
Interest Rate
4.82%
Mortgage Type
New Conventional
Purchase Details
Closed on
Dec 23, 2008
Sold by
Richmond American Homes Of Utah Inc
Bought by
Salisbury Development Lc
Create a Home Valuation Report for This Property
The Home Valuation Report is an in-depth analysis detailing your home's value as well as a comparison with similar homes in the area
Home Values in the Area
Average Home Value in this Area
Purchase History
| Date | Buyer | Sale Price | Title Company |
|---|---|---|---|
| Carter Lindsey Marie | -- | Old Republic Title | |
| Bingham Jathan K | -- | Provo Land Title Company | |
| Salisbury Development Lc | -- | Equity Title Union Park |
Source: Public Records
Mortgage History
| Date | Status | Borrower | Loan Amount |
|---|---|---|---|
| Open | Carter Lindsey Marie | $407,384 | |
| Previous Owner | Bingham Jathan K | $227,979 |
Source: Public Records
Tax History
| Year | Tax Paid | Tax Assessment Tax Assessment Total Assessment is a certain percentage of the fair market value that is determined by local assessors to be the total taxable value of land and additions on the property. | Land | Improvement |
|---|---|---|---|---|
| 2025 | $2,993 | $331,705 | -- | -- |
| 2024 | $2,993 | $304,590 | $0 | $0 |
| 2023 | $3,030 | $309,265 | $0 | $0 |
| 2022 | $2,899 | $291,005 | $0 | $0 |
| 2021 | $2,463 | $396,500 | $108,100 | $288,400 |
| 2020 | $2,338 | $368,300 | $98,300 | $270,000 |
| 2019 | $2,176 | $351,300 | $81,300 | $270,000 |
| 2018 | $1,966 | $306,000 | $71,200 | $234,800 |
| 2017 | $1,826 | $152,845 | $0 | $0 |
| 2016 | $1,717 | $142,780 | $0 | $0 |
| 2015 | $1,586 | $130,955 | $0 | $0 |
| 2014 | $1,457 | $121,220 | $0 | $0 |
Source: Public Records
Map
Nearby Homes
- 582 E 1250 S Unit 137
- 288 E 900 S
- 876 Greenridge Ave
- 336 E 1330 S
- 346 Jay Ln
- 252 E 670 S Unit 2
- 229 E 670 S Unit 7
- 88 W 700 S
- 420 E 600 S
- 549 S Main St
- 551 E 500 S
- 1163 S 730 W
- 1836 S 100 E
- 609 W Saddlebrook Dr
- 245 W 1770 S
- 900 S Goosenest Dr
- 1848 S 100 E Unit 3
- 412 S Goosenest Dr
- 426 S Goosenest Dr
- 1632 S 240 W Unit 47
- 294 E 1100 S Unit 22A
- 294 E 1100 S Unit CW22C
- 294 E 1100 S Unit CW22A
- 244 E 1100 S
- 265 E 1170 S
- 287 E 1170 S
- 243 E 1170 S
- 222 E 1100 S Unit 25A
- 222 E 1100 S Unit CW25A
- 1132 S 300 E
- 295 E 1170 S
- 231 E 1170 S Unit 36A
- 231 E 1170 S
- 194 E 1100 S
- 264 E 1170 S
- 1188 S 300 E
- 296 E 1170 S
- 1185 S 210 E
- 236 E 1170 S
- 203 E 1170 S
Your Personal Tour Guide
Ask me questions while you tour the home.