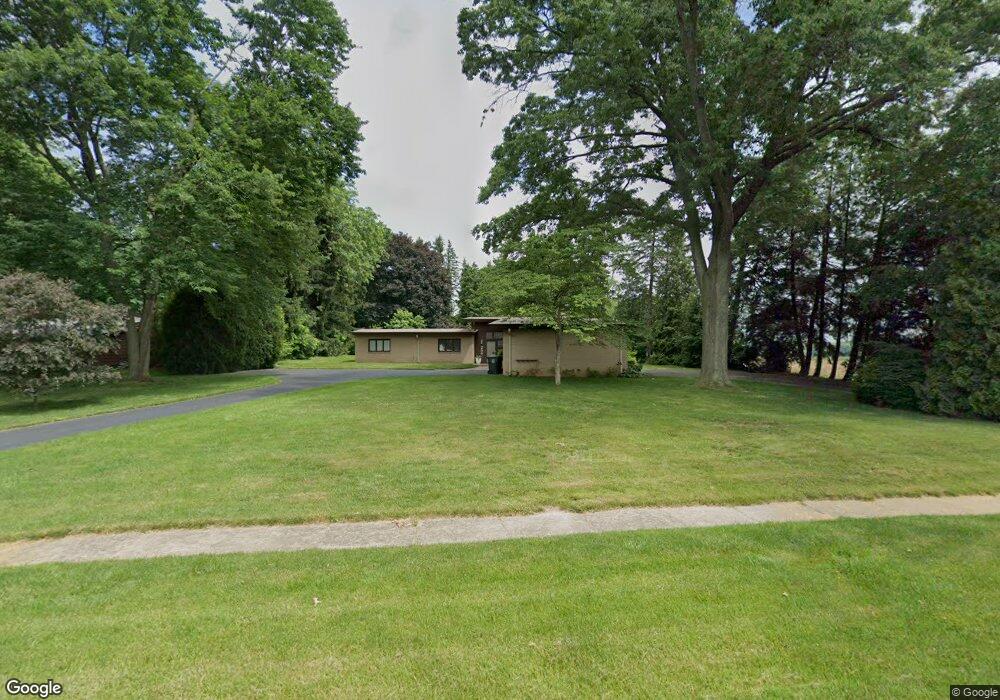
266 E Good Ave Wadsworth, OH 44281
Estimated Value: $326,000 - $382,000
3
Beds
3
Baths
2,843
Sq Ft
$127/Sq Ft
Est. Value
About This Home
This home is located at 266 E Good Ave, Wadsworth, OH 44281 and is currently estimated at $361,476, approximately $127 per square foot. 266 E Good Ave is a home located in Medina County with nearby schools including Valley View Elementary School, Central Intermediate School, and Wadsworth Middle School.
Ownership History
Date
Name
Owned For
Owner Type
Purchase Details
Closed on
Aug 22, 2017
Sold by
Goebel Gene W and Goebel Dorothy
Bought by
Goebel Matthew W
Current Estimated Value
Purchase Details
Closed on
Jan 30, 2014
Sold by
Mccleester Michelle L and Hall Michelle L
Bought by
Goebel Gene W and Goebel Dorothy
Purchase Details
Closed on
May 4, 2011
Sold by
Hall Tommy R and Hall Michelle L
Bought by
Hall Michelle L
Purchase Details
Closed on
Apr 14, 2011
Sold by
Hall Tommy R
Bought by
Hall Michelle L
Purchase Details
Closed on
Mar 26, 2003
Sold by
Decarlo Marilyn Trustee
Bought by
Hall Tommy R and Hall Michelle L
Home Financials for this Owner
Home Financials are based on the most recent Mortgage that was taken out on this home.
Original Mortgage
$213,000
Interest Rate
7.44%
Mortgage Type
Purchase Money Mortgage
Purchase Details
Closed on
May 14, 2001
Sold by
Decarlo Marilyn
Bought by
Decarlo Marilyn
Create a Home Valuation Report for This Property
The Home Valuation Report is an in-depth analysis detailing your home's value as well as a comparison with similar homes in the area
Home Values in the Area
Average Home Value in this Area
Purchase History
| Date | Buyer | Sale Price | Title Company |
|---|---|---|---|
| Goebel Matthew W | -- | None Available | |
| Goebel Gene W | $127,500 | None Available | |
| Hall Michelle L | -- | -- | |
| Hall Michelle L | -- | -- | |
| Hall Tommy R | $228,000 | -- | |
| Decarlo Marilyn | -- | Bond & Associates Title Agen | |
| Decarlo Marilyn | -- | Bond & Associates Title Agen |
Source: Public Records
Mortgage History
| Date | Status | Borrower | Loan Amount |
|---|---|---|---|
| Previous Owner | Hall Tommy R | $213,000 |
Source: Public Records
Tax History
| Year | Tax Paid | Tax Assessment Tax Assessment Total Assessment is a certain percentage of the fair market value that is determined by local assessors to be the total taxable value of land and additions on the property. | Land | Improvement |
|---|---|---|---|---|
| 2024 | $4,798 | $89,650 | $19,250 | $70,400 |
| 2023 | $3,951 | $89,650 | $19,250 | $70,400 |
| 2022 | $3,961 | $89,650 | $19,250 | $70,400 |
| 2021 | $3,746 | $71,720 | $15,400 | $56,320 |
| 2020 | $3,301 | $71,720 | $15,400 | $56,320 |
| 2019 | $3,305 | $71,720 | $15,400 | $56,320 |
| 2018 | $3,283 | $66,810 | $15,720 | $51,090 |
| 2017 | $3,284 | $66,810 | $15,720 | $51,090 |
| 2016 | $3,338 | $66,810 | $15,720 | $51,090 |
| 2015 | $3,302 | $63,030 | $14,830 | $48,200 |
| 2014 | $3,524 | $63,030 | $14,830 | $48,200 |
| 2013 | $3,361 | $63,030 | $14,830 | $48,200 |
Source: Public Records
Map
Nearby Homes
- 681 Highland Ave
- 404 Shannon Dr
- 743 Bent Creek Dr
- 677 Sally Cir
- 388 Crestwood Ave
- 1315 Fieldcrest Dr Unit 90
- 236 Knollwood Dr
- V/L Hartman Rd
- 281 High St
- 579 West St
- 535 West St
- 280 Tanglewood Trail
- 285 Tanglewood Trail
- 198 Summit St
- 216 N Lyman St
- 295 High Point Dr
- 264 Windfall Ln
- 349 Elm St
- 281 Park Place Dr Unit 76
- 290 Park Place Dr Unit 72
- 250 E Good Ave
- 625 Crestwood Ave
- 609 Crestwood Ave
- 265 E Good Ave
- 639 Crestwood Ave
- 645 Crestwood Ave
- 249 E Good Ave
- 591 Crestwood Ave
- 583 Crestwood Ave
- 276 Akron Rd
- 620 Crestwood Ave
- 606 Crestwood Ave
- 628 Crestwood Ave
- 655 Crestwood Ave
- 594 Crestwood Ave
- 260 Akron Rd
- 571 Crestwood Ave
- 640 Crestwood Ave
- 586 Crestwood Ave
- 687 Eastview Ave
Your Personal Tour Guide
Ask me questions while you tour the home.