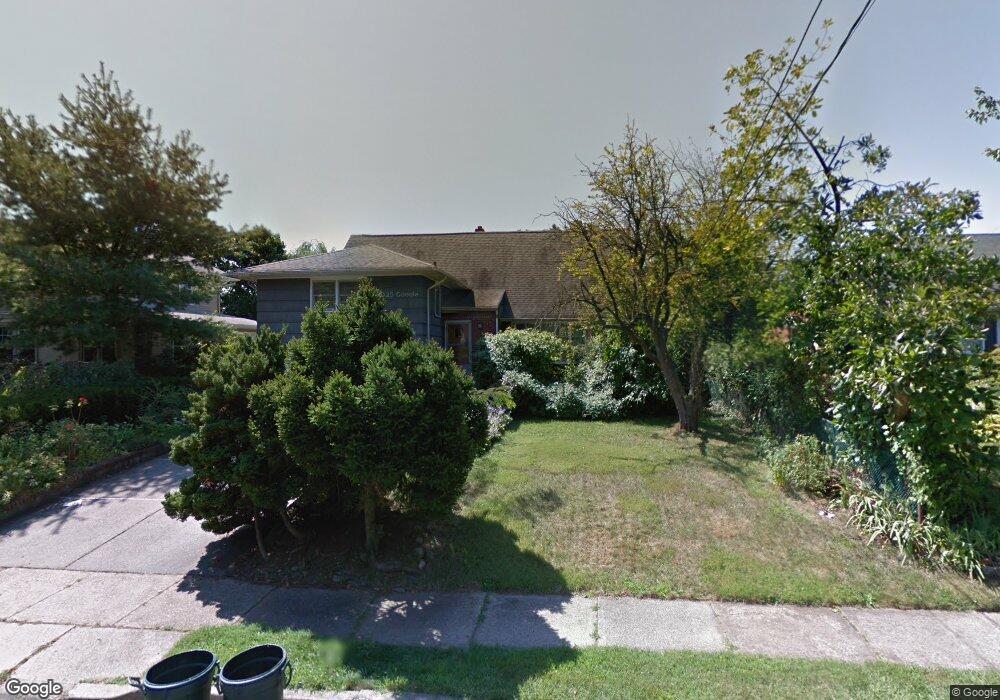
266 Frances St Teaneck, NJ 07666
Estimated Value: $806,961 - $1,013,000
3
Beds
3
Baths
2,284
Sq Ft
$388/Sq Ft
Est. Value
About This Home
This home is located at 266 Frances St, Teaneck, NJ 07666 and is currently estimated at $887,240, approximately $388 per square foot. 266 Frances St is a home located in Bergen County with nearby schools including Teaneck Senior High School, Teaneck Community Charter School, and Bogota Middle School.
Ownership History
Date
Name
Owned For
Owner Type
Purchase Details
Closed on
Sep 30, 2020
Sold by
Gokhale Vedant and Lohani Sharma
Bought by
Armin Adina
Current Estimated Value
Home Financials for this Owner
Home Financials are based on the most recent Mortgage that was taken out on this home.
Original Mortgage
$491,600
Outstanding Balance
$436,455
Interest Rate
2.8%
Mortgage Type
New Conventional
Estimated Equity
$450,785
Purchase Details
Closed on
Oct 26, 2017
Sold by
Ramos Christian A
Bought by
Gokhale Vedant and Lohani Shama
Home Financials for this Owner
Home Financials are based on the most recent Mortgage that was taken out on this home.
Original Mortgage
$468,000
Interest Rate
3.83%
Mortgage Type
Purchase Money Mortgage
Purchase Details
Closed on
May 13, 2015
Sold by
Nestor Nina
Bought by
Ramos Christian A
Purchase Details
Closed on
Aug 22, 1955
Bought by
Nestor Nina
Create a Home Valuation Report for This Property
The Home Valuation Report is an in-depth analysis detailing your home's value as well as a comparison with similar homes in the area
Home Values in the Area
Average Home Value in this Area
Purchase History
| Date | Buyer | Sale Price | Title Company |
|---|---|---|---|
| Armin Adina | $614,500 | Old Republic Natl Ttl Ins Co | |
| Gokhale Vedant | $585,000 | -- | |
| Ramos Christian A | $365,000 | -- | |
| Nestor Nina | -- | -- |
Source: Public Records
Mortgage History
| Date | Status | Borrower | Loan Amount |
|---|---|---|---|
| Open | Armin Adina | $491,600 | |
| Previous Owner | Gokhale Vedant | $468,000 |
Source: Public Records
Tax History
| Year | Tax Paid | Tax Assessment Tax Assessment Total Assessment is a certain percentage of the fair market value that is determined by local assessors to be the total taxable value of land and additions on the property. | Land | Improvement |
|---|---|---|---|---|
| 2025 | $14,259 | $652,900 | $292,600 | $360,300 |
| 2024 | $14,446 | $652,900 | $292,600 | $360,300 |
| 2023 | $14,162 | $437,500 | $184,300 | $253,200 |
| 2022 | $14,162 | $437,500 | $184,300 | $253,200 |
| 2021 | $14,245 | $437,500 | $184,300 | $253,200 |
| 2020 | $14,149 | $437,500 | $184,300 | $253,200 |
| 2019 | $13,987 | $437,500 | $184,300 | $253,200 |
| 2018 | $13,882 | $437,500 | $184,300 | $253,200 |
| 2017 | $10,809 | $343,900 | $184,300 | $159,600 |
| 2016 | $10,418 | $336,500 | $184,300 | $152,200 |
| 2015 | $10,003 | $336,500 | $184,300 | $152,200 |
| 2014 | $10,394 | $414,000 | $239,400 | $174,600 |
Source: Public Records
Map
Nearby Homes
- 264 Merrison St
- 746 Queen Anne Rd
- 681 Palisade Ave
- 857 Garrison Ave
- 1 Grange Ct
- 850 Broad St
- 87 Grayson Place
- 995 Grace Terrace
- 940 Garrison Ave
- 735 Elm Ave Unit 5F
- 489 Maple Ave
- 257 Elm Ave
- 364 Billington Rd
- 1067 Julia St
- 985 Teaneck Rd Unit 1J
- 975-995 Teaneck Rd Unit 1M
- 1096 Margaret St
- 40 Dohrman Ave
- 166 Herrick Ave
- 315 Pine St
- 260 Frances St
- 272 Frances St Unit 2
- 272 Frances St
- 254 Frances St
- 278 Frances St
- 255 Frances St
- 253 Frances St
- 816 Queen Anne Rd
- 275 Frances St
- 279 Frances St
- 286 Frances St
- 251 Frances St
- 285 Frances St
- 265 Cedar Ln Unit 2
- 265 Cedar Ln Unit Top Floor
- 265 Cedar Ln
- 840 Queen Anne Rd
- 840 Queen Anne Rd Unit R2
- 294 Frances St
- 287 Frances St
Your Personal Tour Guide
Ask me questions while you tour the home.