Estimated Value: $659,042 - $754,000
3
Beds
2
Baths
1,488
Sq Ft
$477/Sq Ft
Est. Value
About This Home
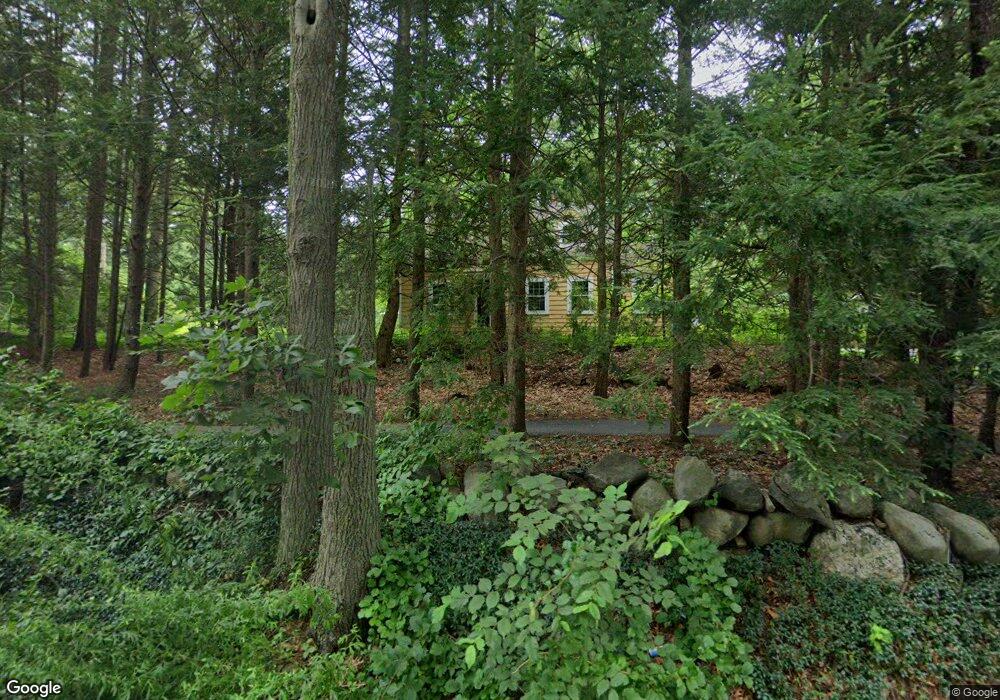
This home is located at 266 High St, Acton, MA 01720 and is currently estimated at $709,761, approximately $476 per square foot. 266 High St is a home located in Middlesex County with nearby schools including Acton-Boxborough Regional High School, Maynard Knowledge Beginnings, and The Imago School.
Ownership History
Date
Name
Owned For
Owner Type
Purchase Details
Closed on
Aug 30, 1999
Sold by
Sundstrom Jon R and Purple Betsy
Bought by
Garver Joseph G and Garver Paul
Current Estimated Value
Home Financials for this Owner
Home Financials are based on the most recent Mortgage that was taken out on this home.
Original Mortgage
$200,000
Interest Rate
7.53%
Mortgage Type
Purchase Money Mortgage
Purchase Details
Closed on
Oct 30, 1990
Sold by
Case Michael A
Bought by
Sundstrom Jon R
Home Financials for this Owner
Home Financials are based on the most recent Mortgage that was taken out on this home.
Original Mortgage
$178,959
Interest Rate
10.08%
Mortgage Type
Purchase Money Mortgage
Create a Home Valuation Report for This Property
The Home Valuation Report is an in-depth analysis detailing your home's value as well as a comparison with similar homes in the area
Home Values in the Area
Average Home Value in this Area
Purchase History
| Date | Buyer | Sale Price | Title Company |
|---|---|---|---|
| Garver Joseph G | $265,000 | -- | |
| Sundstrom Jon R | $199,000 | -- |
Source: Public Records
Mortgage History
| Date | Status | Borrower | Loan Amount |
|---|---|---|---|
| Open | Sundstrom Jon R | $196,000 | |
| Closed | Sundstrom Jon R | $200,000 | |
| Previous Owner | Sundstrom Jon R | $178,959 |
Source: Public Records
Tax History
| Year | Tax Paid | Tax Assessment Tax Assessment Total Assessment is a certain percentage of the fair market value that is determined by local assessors to be the total taxable value of land and additions on the property. | Land | Improvement |
|---|---|---|---|---|
| 2025 | $9,630 | $561,500 | $329,300 | $232,200 |
| 2024 | $9,169 | $550,000 | $329,300 | $220,700 |
| 2023 | $9,128 | $519,800 | $299,100 | $220,700 |
| 2022 | $8,399 | $431,800 | $259,700 | $172,100 |
| 2021 | $8,120 | $401,400 | $240,800 | $160,600 |
| 2020 | $7,567 | $393,300 | $240,800 | $152,500 |
| 2019 | $7,258 | $374,700 | $240,800 | $133,900 |
| 2018 | $7,174 | $370,200 | $240,800 | $129,400 |
| 2017 | $7,056 | $370,200 | $240,800 | $129,400 |
| 2016 | $6,921 | $359,900 | $240,800 | $119,100 |
| 2015 | $7,073 | $371,300 | $240,800 | $130,500 |
| 2014 | $7,004 | $360,100 | $240,800 | $119,300 |
Source: Public Records
Map
Nearby Homes
- 1 Drummer Rd Unit A5
- 96 Forest Ridge Rd Unit 96
- 31 Drummer Rd Unit 31
- 130 Parker St Unit J2
- 70 Powder Mill Rd
- 68 Powder Mill Rd
- 23 Deer Path Unit 5
- 36 Brown St
- 63 Conant St
- 12 Brown St
- 22 Douglas Ave Unit 2
- 22 Douglas Ave Unit 1
- 30 Brewster Ln
- 1 Vanderbelt Rd
- 7 Hillcrest Dr
- 5 Hayes St Unit 5
- 13 Arthur St Unit 15
- 31-33 Roosevelt St
- 1844 Main St Unit 1844
- 40 High St
Your Personal Tour Guide
Ask me questions while you tour the home.